Information Processing Device, Method, Product, and System for Calculation of Reliability of Estimation Value of Number of Present Objects with High Accuracy
Abstract
An information processing device is disclosed. In the information processing device, a derivation unit derives, for each of sensors, a constraint expression obtained by substituting an observation value for a term of an observation value variable in an error model. The observation value indicates the number of present objects observed by the sensors. The error model represents correspondence between: the number of present objects in an observation range represented by the observation value variable and an error term related to an assumed detection error range of the sensor, and the number of present objects in an observation range represented by a variable indicating the number of present objects in an observation unit space. A range calculation unit calculates a possible range of the number of present objects. A reliability calculation unit calculates reliability of an estimation value of the number of present objects for each of the areas.
Claims (18)
1. An information processing device comprising: one or more hardware processors configured to function as: a derivation unit to derive a constraint expression obtained by substituting an observation value for a term of an observation value variable included in an error model, the observation value being an observation value of a number of first present objects observed by one or more sensors disposed in at least part of one or more areas, deriving of the constraint expression being performed for each of the one or more sensors, the error model representing correspondence between a number of second present objects in a first observation range of the sensor represented by the observation value variable of the observation value and an error term related to an assumed detection error range of the sensor, and a number of third present objects in a second observation range of the sensor represented by a variable indicating a number of fourth present objects in an observation unit space determined based on the second observation range of the sensor and a range of each of the one or more areas; a range calculation unit to calculate a possible range of a number of fifth present objects in each of the one or more areas by using the constraint expression; and a reliability calculation unit to calculate, by using the possible range, reliability of an estimation value of the number of the fifth present objects for each of the one or more areas without using the estimation value.
16. An information processing method comprising: deriving a constraint expression obtained by substituting an observation value for a term of an observation value variable included in an error model, the observation value being an observation value of a number of first present objects observed by one or more sensors disposed in at least part of one or more areas, the deriving of the constraint expression being performed for each of the one or more sensors, the error model representing correspondence between a number of second present objects in a first observation range of the sensor represented by the observation value variable of the observation value and an error term related to an assumed detection error range of the sensor, and a number of third present objects in a second observation range of the sensor represented by a variable indicating a number of fourth present objects in an observation unit space determined based on the second observation range of the sensor and a range each of the one or more areas; calculating a possible range of a number of fifth present objects in each of the one or more areas by using the constraint expression; and calculating, by using the possible range, reliability of an estimation value of the number of the fifth present objects for each of the one or more areas without using the estimation value.
17. A computer program product comprising a non-transitory computer-readable recording medium on which a program executable by a computer is recorded, the program instructing the computer to: derive a constraint expression obtained by substituting an observation value for a term of an observation value variable included in an error model, the observation value being an observation value of a number of first present objects observed by one or more sensors disposed in at least part of one or more areas, deriving of the constraint expression being performed for each of the one or more sensors, the error model representing correspondence between a number of second present objects in a first observation range of the sensor represented by the observation value variable of the observation value and an error term related to an assumed detection error range of the sensor, and a number of third present objects in a second observation range of the sensor represented by a variable indicating a number of fourth present objects in an observation unit space determined based on the second observation range of the sensor and a range of each of the one or more areas; calculate a possible range of a number of fifth present objects in each of the one or more areas by using the constraint expression; and calculate, by using the possible range, reliability of an estimation value of the number of the fifth present objects for each of the one or more areas without using the estimation value.
18. An information processing system comprising: one or more sensors disposed in at least part of one or more areas; and one or more hardware processors configured to function as a derivation unit to derive, for each of the one or more sensors, a constraint expression obtained by substituting an observation value for a term of an observation value variable included in an error model, the observation value being an observation value of a number of first present objects observed by the one or more sensors, the error model representing correspondence between a number of second present objects in a first observation range of the sensor represented by the observation value variable of the observation value and an error term related to an assumed detection error range of the sensor, and a number of third present objects in a second observation range of the sensor represented by a variable indicating a number of fourth present objects in an observation unit space determined based on the second observation range of the sensor and a range of each of the one or more areas, a range calculation unit to calculate a possible range of a number of fifth present objects in each of the one or more areas by using the constraint expression, and a reliability calculation unit to calculate, by using the possible range, reliability of an estimation value of the number of the fifth present objects for each of the one or more areas without using the estimation value.
Show 14 dependent claims
2. The information processing device according to claim 1 , wherein the one or more hardware processors are further configured to function as an acquisition unit to acquire the observation value from the sensor.
3. The information processing device according to claim 2 , wherein the derivation unit derives, for each of the one or more sensors, the constraint expression obtained by substituting an acquired observation value for the term of the observation value variable included in the error model representing the number of the third present objects in the second observation range of the sensor represented by the variable using an area ratio of the area included in the second observation range.
4. The information processing device according to claim 1 , wherein the one or more hardware processors are further configured to function as an estimation unit to estimate the number of the fifth present objects in each of the one or more areas based on the observation value.
5. The information processing device according to claim 4 , wherein the range calculation unit corrects the possible range by the estimation value in a case where an estimation value of the number of the fifth present objects estimated by the estimation unit is out of the possible range.
6. The information processing device according to claim 1 , wherein the range calculation unit calculates the possible range of the number of the fifth present objects in each of the one or more areas by using the constraint expression and setting information, the setting information including a lower bound and/or an upper bound of at least one of the variable, the number of the fifth present objects that are able to be present in the area, the error term, and a number of sixth present objects that are able to be observed by the sensor.
7. The information processing device according to claim 6 , wherein the range calculation unit obtains estimation information about the number of the fifth present objects in each of the one or more areas by solving, based on priority definition information in which a combination of weight values is specified for each combination of groups to which the one or more sensors belong, a mathematical optimization problem of an objective function that satisfies a constraint condition represented by the constraint expression and is specified by the error term and the combination of the weight values, and calculates the possible range by using the estimation information.
8. The information processing device according to claim 7 , wherein the range calculation unit calculates variation of the estimation value as the possible range.
9. The information processing device according to claim 6 , wherein the number of the first present objects through the number of the sixth present objects are each a number of present people.
10. The information processing device according to claim 1 , wherein the range calculation unit calculates endpoints of the possible range of the number of the fifth present objects in each of the one or more areas by solving a mathematical optimization problem of an objective function that satisfies a constraint condition represented by the constraint expression, the objective function being represented by a configuration of the variable of the observation unit space included in the area.
11. The information processing device according to claim 4 , wherein the range calculation unit calculates, as the endpoint of the possible range, a value obtained by correcting a solution obtained by solving the mathematical optimization problem based on an endpoint definition determined in advance.
12. The information processing device according to claim 1 , wherein the reliability calculation unit calculates, as the reliability, an inverse number of a difference between a maximum endpoint and a minimum endpoint of the possible range.
13. The information processing device according to claim 1 , wherein the reliability calculation unit calculates, as the reliability, a value proportional to a difference between a maximum endpoint and a minimum endpoint of the possible range.
14. The information processing device according to claim 1 , wherein the derivation unit describes the constraint expression in which the variable indicates an integrated variable obtained by integrating at least part of variables of observation unit spaces included in the second observation range of the sensor, and the range calculation unit calculates a range of the number of the third present objects for the second observation range of the sensor by using the constraint expression, and calculates the possible range of the number of the fifth present objects in the area by distributing the calculated range of the number of the fifth present objects to each of observation unit spaces by using area ratios of the observation unit spaces included in the second observation range.
15. The information processing device according to claim 14 , wherein the variables integrated as the integrated variable are variables whose observation unit spaces are present in an observation space of a same sensor.
Full Description
Show full text →
CROSS-REFERENCE TO RELATED APPLICATIONS
This application is based upon and claims the benefit of priority from Japanese Patent Application No. 2022-044222, filed on Mar. 18, 2022; the entire contents of which are incorporated herein by reference.
FIELD
Embodiments described herein relate generally to an information processing device, an information processing method, a computer program product, and an information processing system.
BACKGROUND
There is a knowns system for estimating the number of present people in each of one or more areas included in a space inside a building and the like. For example, an estimation value of the number of present people is calculated by using a statistical model and an observation value acquired from a sensor installed in the area. There is a related art that discloses a method of calculating an estimation value of the number of present people and reliability of the estimation value of the number of present people on the assumption that error distribution of the sensor is normal distribution whose average is zero (0).
However, an event different from the assumption may occur in a real environment such that error distribution is not normal distribution, for example. Thus, in the related art, there is a case in which high reliability is derived for the estimation value although the reliability of the estimation value is actually low, and deviation between the estimation value and an actual measured value may be caused. That is, in the related art, it has been difficult to calculate the reliability of the estimation value of the number of present objects such as the number of present people in the area with high accuracy.
BRIEF DESCRIPTION OF THE DRAWINGS
is a schematic diagram of an information processing system;
is an explanatory diagram of an area included in a space as an observation target;
is an explanatory diagram of a data configuration of an observation value file;
is an explanatory diagram of observation unit spaces and variables;
A is a schematic diagram of a data configuration of an error model;
B is a schematic diagram of a data configuration of an error model;
C is a schematic diagram of a data configuration of an error model;
D is a schematic diagram of a data configuration of an error model;
is an explanatory diagram of a possible range of the number of present people;
is a schematic diagram of a data configuration of a range definition DB;
is a schematic diagram of a data configuration of a reliability file;
is a schematic diagram of a data configuration of an estimation value file;
is a flowchart illustrating a procedure of information processing;
is a flowchart illustrating a procedure of constraint expression derivation processing;
is a flowchart illustrating a procedure of range calculation processing;
is a flowchart illustrating a procedure of reliability calculation processing;
is a schematic diagram of an information processing system;
A is a schematic diagram of a data configuration of a priority definition DB;
B is a schematic diagram of a data configuration of a priority definition DB;
is a schematic diagram of a data configuration of a simulation table;
is a flowchart illustrating a procedure of range calculation processing;
is a flowchart illustrating a procedure of reliability calculation processing;
A is a schematic diagram of a data configuration of an error model DB;
B is a schematic diagram of a data configuration of an error model DB;
C is a schematic diagram of a data configuration of an error model DB;
is a schematic diagram of an information processing system;
is a flowchart illustrating a procedure of information processing;
is a flowchart illustrating a procedure of range calculation processing;
is a flowchart illustrating a procedure of correction processing;
is an explanatory diagram of an integrated variable;
A is a schematic diagram of a data configuration of an error model DB;
B is a schematic diagram of a data configuration of an error model DB;
C is a schematic diagram of a data configuration of an error model DB;
is a flowchart illustrating a procedure of range calculation processing;
is a flowchart illustrating a procedure of range calculation processing; and
is a hardware configuration diagram.
DETAILED DESCRIPTION
An information processing device according to an embodiment includes one or more hardware processors configured to function as a derivation unit, a range calculation unit, and a reliability calculation unit. The derivation unit serves to derive, for each of sensors, a constraint expression obtained by substituting an observation value for a term of an observation value variable included in an error model. The observation value is an observation value of the number of present objects observed by one or more sensors disposed in at least part of one or more areas. The error model represents correspondence between: the number of present objects in an observation range of the sensor represented by the observation value variable of the observation value and an error term related to an assumed detection error range of the sensor, and the number of present objects in an observation range of the sensor represented by a variable indicating the number of present objects in an observation unit space determined on the basis of the observation range of the sensor and a range of the area. The range calculation unit serves to calculate a possible range of the number of present objects in the area by using the constraint expression. The reliability calculation unit serves to calculate, by using the possible range, reliability of an estimation value of the number of present objects for each of the areas.
The following describes an information processing device, an information processing method, a computer program, and an information processing system in detail with reference to the attached drawings.
In the following description of embodiments and modifications, portions denoted by the same reference numeral substantially have the same function, and description about duplicate portions will be appropriately omitted.
First Embodiment
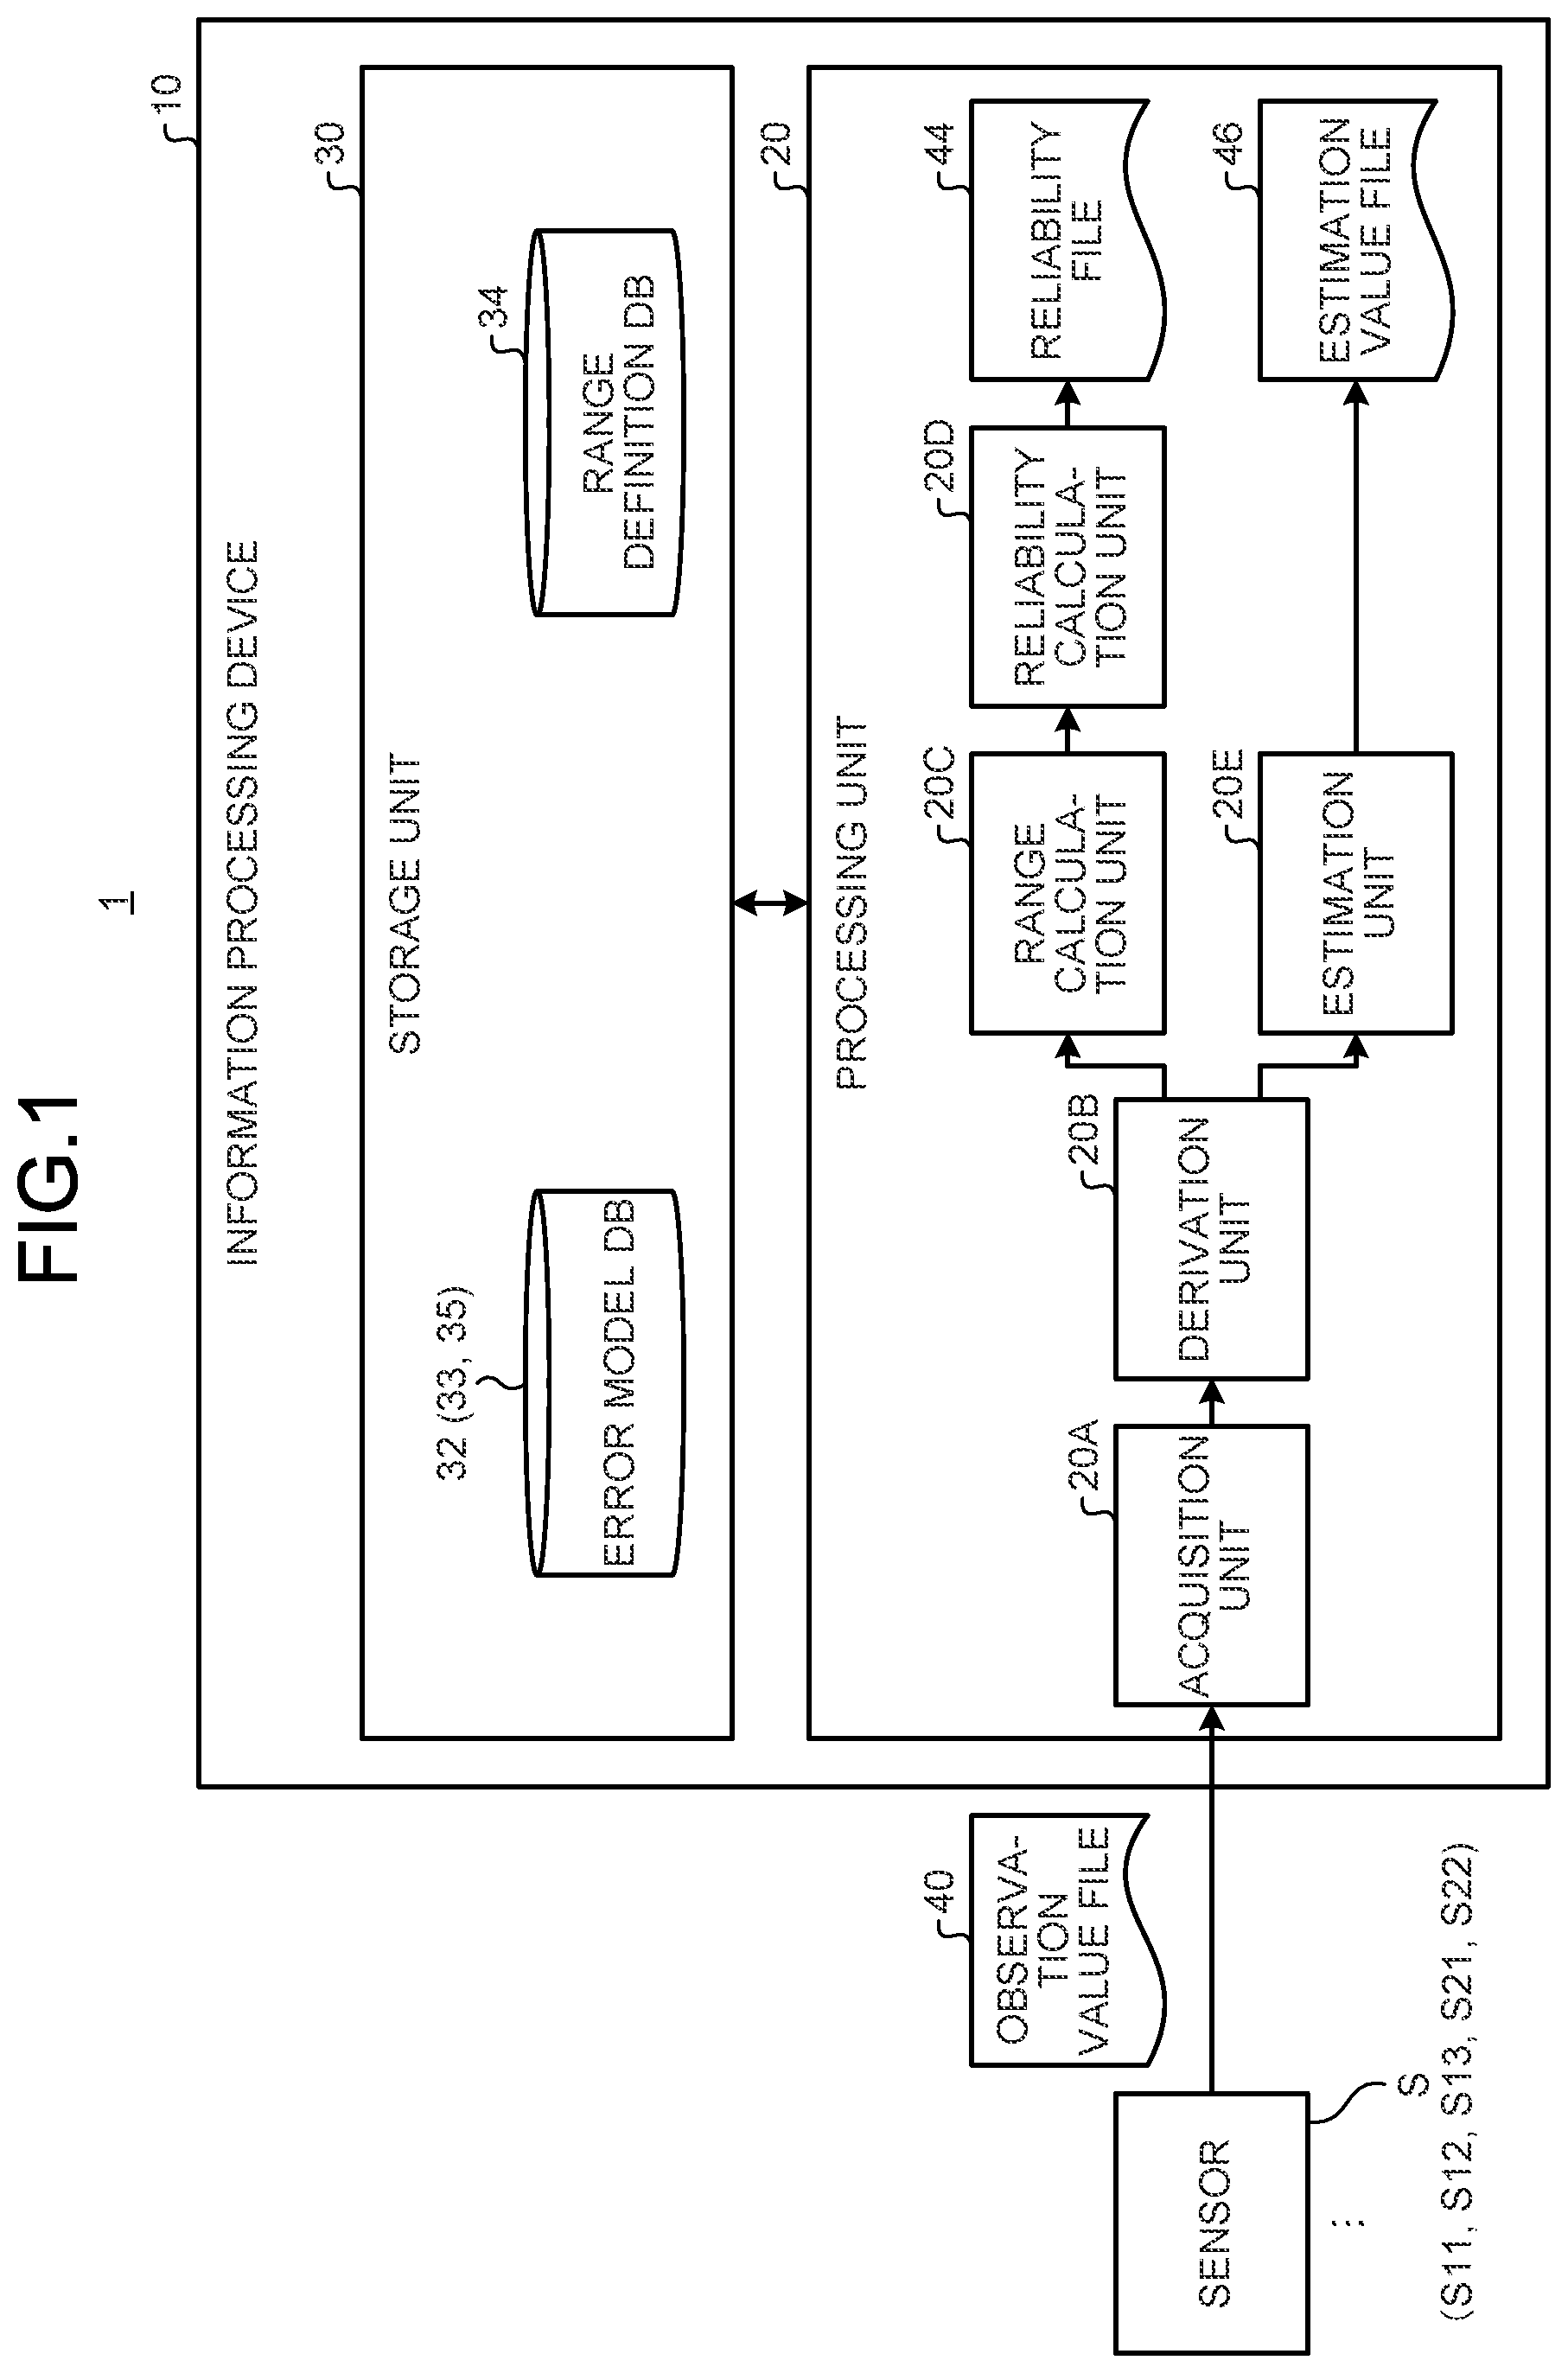
is a schematic diagram of an example of an information processing system 1 according to the present embodiment.
The information processing system 1 includes a sensor S and an information processing device 10 . The information processing device 10 and the sensor S are connected to each other in a communicable manner.
The information processing device 10 is a system for estimating the number of present objects in an area and deriving reliability of an estimation value of the number of present objects on the basis of an observation value obtained by observing the area as an estimation target for the number of present objects. The number of present objects in the area means the number of objects present in the area. An element may be any object whose number can be directly or indirectly detected by the sensor S. The object is, for example, a person, an animal such as a bird or a dog, a plant, a cell, a mobile object such as an automobile, a stationary object that is a non-mobile object, or the like. The present embodiment exemplifies a form in which a prime object is a person, and the number of present objects is the number of present people. The number of present people in an area is the number of people present in the area.
is an explanatory diagram of an example of areas EA included in a space MS as an observation target. The space MS as the observation target is a space as a target for observing the number of present people. The space MS as the observation target is, for example, a space inside a building, a space inside a room, and the like, but is not limited thereto. The space MS as the observation target is classified into one or more areas EA in advance.
The present embodiment exemplifies a form in which the space MS as the observation target is classified into the n areas EA. n is an integral number equal to or larger than 1. The present embodiment exemplifies a form in which the space MS as the observation target is divided into the areas EA, and n is an integral number equal to or larger than 2. Specifically, the present embodiment exemplifies a form in which n=4. Thus, exemplifies a form in which the space MS as the observation target is divided into the four areas EA including an area EA1 to an area EA4 to be managed. Hereinafter, in a case of collectively explaining the area EA1 to the area EA4, the area EA1 to the area EA4 may be simply referred to as the areas EA in some cases.
A shape of the area EA may be an optional shape. exemplifies a form in which the shape of each of the areas EA is a rectangular shape as an example. However, the shape of the area EA may be any shape such as a circular shape, an elliptical shape, or a polygonal shape other than a quadrangular shape. At least some of the shapes of the areas EA in the space MS as the observation target may be different from each other.
One or more sensors S are disposed in at least part of the areas EA.
The sensor S is a sensor for obtaining an observation value of the number of present people within an observation range of the sensor S. Examples of the sensor S include the sensor S that directly or indirectly observes the number of present people. Examples of the sensor S that directly observes the number of present people include a gate sensor, a Wireless Fidelity (WiFi) sensor, and a beacon sensor. Examples of the sensor S that indirectly observes the number of present people include a CO 2 concentration sensor, an electric energy sensor, a temperature sensor, and the like each indirectly observing the number of present people using statistics, machine learning, and the like. In a case of using the CO 2 concentration sensor as the sensor S, the number of present people can be indirectly observed by considering and estimating an amount of exhalation per person. In a case of using the electric energy sensor as the sensor S, the number of present people can be indirectly observed by considering and estimating a power consumption amount per person. In a case of using the temperature sensor as the sensor S, the number of present people can be indirectly observed by considering and estimating a heat rising amount per person.
Types of the sensors S disposed in the space MS as the observation target may be the same type or different types. The present embodiment exemplifies a form in which j types of and i or more sensors S are disposed in the space MS as the observation target. Herein, j is an integral number equal to or larger than 1, and represents the type of the sensor S. Specifically, the present embodiment describes an example in which j=2, and two types of the sensors S are disposed. i represents the number of sensors S belonging to each of the types. In the present embodiment, the sensors S each represented by Sji are disposed in the space MS as the observation target.
Specifically, exemplifies a state in which two types of the sensors S are disposed, the two types of sensors S including a sensor S11 to a sensor S13, and sensors S21 to S22 as the sensors S of a type different from that of the sensor S11 to the sensor S13. That is, the present embodiment exemplifies a case of using Sji as identification information for each of the sensors S. Sji means the i-th sensor S belonging to the type represented by j.
The sensor S11 to the sensor S13 represent the three sensors S (i=1 to 3) belonging to the type represented by j=1. A space surrounded by a dashed line in indicates an observation range of each of the sensor S11 to the sensor S13. The sensor S21 to the sensor S22 represent the two sensors S (i=1 to 2) belonging to the type represented by j=2. A space indicated by hatching in indicates an observation range of each of the sensor S21 and the sensor S22.
The shape of the space of the observation range of each of the sensors S may be an optional shape, and is not limited to a rectangular shape.
Returning to , the description will be continued. In the present embodiment, the information processing device 10 derives the estimation value of the number of present people in each of the areas EA, and the reliability of the estimation value of the number of present people on the basis of the observation value of the number of present people obtained by each of the sensors S.
The information processing device 10 includes a processing unit 20 and a storage unit 30 . The processing unit 20 and the storage unit 30 are connected to each other in a communicable manner via a bus and the like.
The storage unit 30 stores various kinds of data. In the present embodiment, the storage unit 30 stores an error model DB (database) 32 and a range definition DB 34 . The error model DB 32 and the range definition DB 34 are stored in the storage unit 30 in advance, and used at the time of processing performed by the processing unit 20 described later. Details about these databases will be described later.
The processing unit 20 performs information processing in the information processing device 10 . The processing unit 20 includes an acquisition unit 20 A, a derivation unit 20 B, a range calculation unit 20 C, a reliability calculation unit 20 D, and an estimation unit 20 E.
The acquisition unit 20 A, the derivation unit 20 B, the range calculation unit 20 C, and the estimation unit 20 E may be implemented by one or more processors. For example, each of the units described above may be implemented by causing a processor such as a central processing unit (CPU) to execute a computer program, that is, by software. Each of the units described above may also be implemented by a processor such as a dedicated IC, that is, by hardware. Each of the units described above may also be implemented by using both of software and hardware. In a case of using two or more processors, each of the processors may implement one of the units, or may implement two or more of the units.
Alternatively, at least one of the units described above, or at least part of information stored in the storage unit 30 may be mounted on an external information processing device that is connected to the information processing device 10 in a communicable manner.
The acquisition unit 20 A acquires observation values of the number of present people from one or more sensors S disposed in at least part of one or more areas EA. In the present embodiment, the acquisition unit 20 A acquires observation values respectively observed by the sensor S11 to the sensor S13 and the sensor S21 to the sensor S22, and outputs an observation value file 40 including these observation values to the derivation unit 20 B.
is an explanatory diagram of an example of a data configuration of the observation value file 40 . The observation value file 40 is a file in which a sensor ID, observation date and time of the observation value, and the observation value are associated with each other. The observation value file 40 is a file in a table format, and written in a Comma-Separated Values (CSV) format, for example. A data format of the observation value file 40 may be an optional data format, and is not limited to the table format.
The sensor ID is identification information for the sensor S. As described above, the present embodiment describes a case of representing the sensor ID as Sji. Sji means the i-th sensor S belonging to the type represented by j.
The date and time represent the observation date and time of the observation value. For example, the date and time are written in a format such as “YYYY/MM/DD hh: mm: ss”. YYYY represents the dominical year, MM represents a month, and DD represents a date. hh represents a time, mm represents a minute, and ss represents a second.
The observation value represents the observation value of the number of present people observed by the sensor S that is identified with the sensor ID. The observation value is represented by the number of people, that is, an integral number equal to or larger than 1. In a case in which the observation value is the number of people “0 (zero)”, “NA” is used as the observation value.
Returning to , the description will be continued. The acquisition unit 20 A outputs the observation value file 40 to the derivation unit 20 B. The observation value file may be a file including the observation value of at least one sensor S and at least one date and time.
The derivation unit 20 B derives a constraint expression for each of the sensors S.
The constraint expression is an expression representing a constraint condition used at the time of solving a mathematical optimization problem by the range calculation unit 20 C (described later). The constraint expression is an expression that is derived by substituting the observation value acquired by the acquisition unit 20 A for a term of an observation value variable included in an error model. The error model is a model including the observation value variable of the observation value of the sensor S, and defining a relation between an error term related to an assumed detection error range of the sensor S and a variable X representing the number of present people in the observation unit space. Details about the error model will be described later.
The observation unit space is a space as a minimum unit defined by the observation range of the sensor S and a range of the area EA in the space MS as the observation target. In other words, the observation unit space is each space partitioned by a boundary line representing a boundary of the observation range of the sensor S and a boundary line of the area EA.
is an explanatory diagram of an example of observation unit spaces and variables X in the space MS as the observation target. To the space MS as the observation target, m variables X are assigned. m is an integral number equal to or larger than 1, and is the number of observation unit spaces included in the space MS as the observation target.
In , a variable X1 to a variable X8 represent the numbers of present people in the respective observation unit spaces that are spaces partitioned by the boundary line representing the boundary of the observation range of the sensor S and the boundary line of the area EA. The variable X1 to the variable X8 are examples of the variables X. Moreover, in , eight observation unit spaces are included in the space MS as the observation target. Thus, eight variables X1 to X8 are illustrated as the variables X included in the space MS as the observation target by way of example.
The number of the observation unit spaces included in the space MS as the observation target is determined on the basis of the observation range of each of the sensors S and the range of the area EA, and is not limited to eight.
The variable X is not necessarily given to the observation unit space having an area in which a person cannot be present among the observation unit spaces included in the space MS as the observation target. As this area, an area smaller than a minimum area required for one person to be present may be determined, for example.
The number of present people in each of the areas EA included in the space MS as the observation target can be represented by a configuration of the variables X of one or more observation unit spaces included in the area EA. For example, in a case of the example illustrated in , a relation between each of the area EA1 to the area EA4 and the variables X is represented by the following expression (1) to expression (4). EA 1= X 1 (1) EA 2= X 2+ X 3 (2) EA 3= X 4+ X 5 (3) EA 4= X 6+ X 7+ X 8 (4)
In the expression (1) to the expression (4), EA1 to EA4 respectively represent the numbers of present people in the area EA1 to the area EA. X1 to X8 respectively represent the variable X1 to the variable X8.
As described above, the number of present people in each of the areas EA included in the space MS as the observation target is represented by the configuration of one or more variables X. Thus, a relation between the observation value obtained by each of the sensors S and the variable X is represented by the following expression (5) to expression (9). Y 11= X 1+ X 2+ X 8 (5) Y 12= X 3+ X 4 (6) Y 13= X 5+ X 6+ X 7 (7) Y 21= X 6 (8) Y 22= X 7+ X 8 (9)
In the expressions (5) to (9), Y11 to Y22 are values each represented by Yji. i and j are the same as those described above. That is, Yji represents an observation value obtained by the sensor S represented by Sji. Specifically, Y11 to Y22 respectively represent observation values obtained by the sensor S11 to the sensor S22.
Returning to , the description will be continued. The derivation unit 20 B derives a constraint expression using the observation value file 40 acquired from the acquisition unit 20 A and the error model DB 32 defining the variables X and the like.
The error model DB 32 is a database for defining a constraint expression.
A to D are schematic diagrams illustrating examples of a data configuration of the error model DB 32 . For example, the error model DB 32 includes a variable definition table 32 A, an area definition table 32 B, an error term definition table 32 C, and an error model definition table 32 D.
In each of the tables described above included in the error model DB 32 , values of an upper bound representing an upper limit value and a lower bound representing a lower limit value are set in advance. In these tables, at least one of values of the upper bound and the lower bound is not necessarily set. In this case, “NA” may be registered as a value in a field of the upper bound or the lower bound in which the value is not set.
A is a schematic diagram illustrating an example of a data configuration of the variable definition table 32 A. The variable definition table 32 A is a table specifying the upper bound and the lower bound of the number of present people for each of the variables X included in the space MS as the observation target.
Specifically, the variable definition table 32 A is a table in which a variable name, the lower bound, and the upper bound are associated with each other. The variable name is identification information for the variable X included in the space MS as the observation target. A exemplifies X1 to X8 as variable names of the variable X1 to the variable X8, respectively. The lower bound in the variable definition table 32 A represents a lower limit value of the number of present people represented by the variable X identified with a corresponding variable name. The upper bound in the variable definition table 32 A represents an upper limit value of the number of present people represented by the variable X identified with a corresponding variable name.
As described above, the variable X represents the number of present people in the observation unit space. A exemplifies a case in which “0” is set in advance as the value of the lower bound corresponding to the variable X identified with each of the variable names. However, an integral number equal to or larger than 1 may be set in advance as the value of the lower bound. A exemplifies a case in which “NA” is set in advance, “NA” representing that the value is not set, as the value of the upper bound corresponding to the variable X identified with each of the variable names is not set. However, an integral number equal to or larger than 1 may be set in advance as the value of the upper bound. For example, as the value of the upper bound in the variable definition table 32 A, a value obtained by dividing a space area of the observation unit space corresponding to the variable X identified with a corresponding variable name by a required space area for one person may be set in advance.
B is a schematic diagram illustrating an example of a data configuration of the area definition table 32 B. The area definition table 32 B is a table specifying the configuration of the variables X in the observation unit space included in the area EA, and the lower bound and the upper bound of the number of present people for each of the areas EA included in the space MS as the observation target.
Specifically, the area definition table 32 B is a table in which an area ID, the configuration, the lower bound, and the upper bound are associated with each other. The area ID is identification information for the area EA. B illustrates EA1 to EA4 as respective area IDs of the area EA1 to the area EA4 included in the space MS as the observation target. The configuration represents a configuration of the variables X of the observation unit space included in the area EA identified with a corresponding area ID. The configuration of the variables X is represented by a combination of the variable names as pieces of the identification information for the respective variables X. For example, in the area definition table 32 B, configurations satisfying respective relations represented by the expression (1) to the expression (4) described above are set in advance while being associated with respective area IDs.
The lower bound and the upper bound in the area definition table 32 B respectively represent a lower limit value and an upper limit value of the number of present people who may be present in the area EA identified with a corresponding area ID.
As described above, the variable X represents the number of present people in the observation unit space. B exemplifies a case in which “0” is set in advance as a value of the lower bound that is the lower limit value of the number of present people corresponding to the area EA identified with each of the area IDs. However, an integral number equal to or larger than 1 may be set in advance as the value of the lower bound. B exemplifies a case in which “50” or “NA” is set in advance, “NA” representing that the value is not set, as the value of the upper bound as the upper limit value of the number of present people corresponding to the area EA identified with each of the area IDs. However, the value of the upper bound is not limited to the values illustrated in B , and NA or an integral number equal to or larger than 1 may be set in advance as the value of the upper bound. As the value of the upper bound in the area definition table 32 B, for example, a value obtained by dividing the space area of the area EA identified with a corresponding area ID by the required space area for one person may be set in advance.
C is a schematic diagram illustrating an example of a data configuration of the error term definition table 32 C. The error term definition table 32 C is a table specifying an assumed detection error range of the sensor S for each of the sensors S.
The assumed detection error range is represented by an assumed minimum error value and an assumed maximum error value of the sensor S. The error term is an item related to the assumed detection error range of the sensor S. In other words, the error term is a variable representing any of values in the assumed detection error range of the sensor S.
Specifically, the error term definition table 32 C is a table in which an error term name, the sensor ID, a lower bound, and an upper bound are associated with each other.
The error term name is a name of the error term. In C , the error term name is represented by epsji. i and j are already described above. That is, epsji represents the error term name of the error term of the sensor S represented by Sji. Specifically, eps11 to eps22 respectively represent error term names of error terms of the sensor S11 to the sensor S22.
The sensor ID is identification information for the sensor S included in the space MS as the observation target. In the present embodiment, as described above, Sji is used for the sensor ID. C illustrates S11 to S22 as respective sensor IDs of the sensor S11 to the sensor S22 included in the space MS as the observation target.
The lower bound in the error term definition table 32 C represents a minimum error value of the assumed detection error range of the sensor S identified with a corresponding sensor ID. The upper bound in the error term definition table 32 C represents a maximum error value of the assumed detection error range of the sensor S identified with a corresponding sensor ID.
The assumed detection error range of each of the sensors S is specified by the lower bound and the upper bound in the error term definition table 32 C. That is, in the error term definition table 32 C, the assumed detection error range specified by the lower bound and the upper bound, and the error term name of the error term representing the variable in the assumed detection error range of each of the sensors S identified with the sensor ID are associated with each other and set in advance.
In C , an example is illustrated such that one error term is set for each one of the sensors S. The present embodiment can also be applied to a form in which plural error terms are set for each one of the sensors S, or a form in which the error term is not set for each one of the sensors S.
D is an explanatory diagram of an example of a data configuration of the error model definition table 32 D. The error model definition table 32 D is a table specifying a format of the constraint expression for each of the sensors S included in the space MS as the observation target.
Specifically, the error model definition table 32 D is a table in which the sensor ID, the observation value variable, the error model, an upper bound, and a lower bound are associated with each other. The sensor ID is the same as that described above. The observation value variable in the error model definition table 32 D is a variable of the observation value acquired from the sensor S identified with a corresponding sensor ID.
The error model is a model representing a format of the constraint expression. As described above, the error model is a model including the observation value variable of the observation value, and specifying a relation between the variable X and the error term related to the assumed detection error range of the sensor S for each of the sensors S. As described above, the assumed detection error range is represented by the assumed minimum error value and the assumed maximum error value of the sensor S. The error term is a variable representing the assumed detection error range of the sensor S.
For details, the error model represents correspondence between the number of present people in the observation range of the sensor S represented by the observation value variable of the observation value and the error term related to the assumed detection error range of the sensor S, and the number of present people in the observation range of the sensor S represented by the variable X representing the number of present people in the observation unit space.
Specifically, as illustrated in D , the error model is represented by an expression connecting a left side and a right side each representing the number of present people in the observation range of the sensor S by an equal sign. The left side of the expression representing the error model represents the number of present people in the observation range of the sensor S by a total value of the observation value variable and the error term. The right side of the expression representing the error model represents the number of present people in the observation range of the sensor S by a total value of the variables X each representing the number of present people in the observation unit space.
That is, the error model is a model in which the assumed detection error range obtained from the error term “epsji” is represented by the number of present people obtained by the observation value variable and the variable X.
The lower bound in the error model definition table 32 D represents a lower limit value of the number of present people that may be observed by the sensor S identified with a corresponding sensor ID. The upper bound in the error model definition table 32 D represents an upper limit value of the number of present people that may be observed by the sensor S identified with a corresponding sensor ID.
D exemplifies a case in which “0” is set in advance as the value of the lower bound representing the lower limit value of the number of present people that may be observed by the sensor S identified with the sensor ID. However, an integral number equal to or larger than 1 may be set in advance as the value of the lower bound. D exemplifies a case in which an integral number or “NA” is set in advance, “NA” representing that the value is not set, as the value of the lower bound representing the lower limit value of the number of present people that may be observed by the sensor S identified with the sensor ID. As the value of the upper bound in the error model definition table 32 D, for example, a value obtained by dividing the space area of the observation range of the sensor S identified with a corresponding sensor ID by the required space area for one person may be set in advance.
Each of the tables illustrated in A to D may further include a field representing a time period. Values representing the upper bound and the lower bound corresponding to the time period may be set in advance for each time period.
Returning to , the description will be continued. The derivation unit 20 B derives the constraint expression for each of the sensors S by substituting the observation value acquired from the acquisition unit 20 A for a term of the observation value variable included in the error model of the error model DB 32 .
Specifically, the derivation unit 20 B reads the error model DB 32 from the storage unit 30 .
The derivation unit 20 B then sets corresponding upper bound and lower bound specified in the variable definition table 32 A for each of the variables X1 identified with the respective variable names specified in the variable definition table 32 A. The derivation unit 20 B also sets corresponding lower bound and upper bound specified in the area definition table 32 B for each of the areas EA identified with the respective area IDs specified in the area definition table 32 B. The derivation unit 20 B also sets corresponding lower bound and upper bound specified in the error term definition table 32 C for each of the error terms identified with the respective error term names specified in the error term definition table 32 C. The derivation unit 20 B does not set a value for the upper bound and the lower bound for which “NA” is set.
The derivation unit 20 B then acquires the observation value of each of the sensor S included in the observation value file 40 received from the acquisition unit 20 A. The derivation unit 20 B also reads the error model corresponding to each of the sensor IDs in the error model definition table 32 D. The derivation unit 20 B then derives the constraint expression by substituting the acquired observation value for the term of the observation value variable included in the error model of the corresponding sensor S.
For example, the derivation unit 20 B substituting the observation value acquired from the sensor S11 identified with the sensor ID “S11” for the term of the observation value variable “Y11” of the error model corresponding to the sensor ID “S11” in the error model definition table 32 D illustrated in D . Through this processing, the derivation unit 20 B derives the constraint expression for the sensor S11. The derivation unit 20 B similarly derives the constraint expression for each of the other sensors S.
The derivation unit 20 B then sets the lower bound and the upper bound of the number of present people observed by the sensor S by using any of the left side and the right side of the derived constraint expression.
Specifically, for example, the following describes a case in which the derivation unit 20 B derives the constraint expression, and the upper bound and the lower bound corresponding to the constraint expression using the error model definition table 32 D illustrated in A to D . Assumed is a case in which the observation values of the sensor S11, the sensor S12, the sensor S13, the sensor S21, and the sensor S22 are 28 , 21 , 16 , 10 , and 10 , respectively. In this case, the upper bound and the lower bound set by each of the tables included in the error model DB 32 , and the constraint expression are as follows.
•
• Lower bound of each variable X set by variable definition table 32 A 0≤ X 1 0≤ X 2 0≤ X 3 0≤ X 4 0≤ X 5 0≤ X 6 0≤ X 7 0≤ X 8
As illustrated in A , “NA” is set for the upper bound, so that only the lower bound is set.
•
• Lower bound and upper bound of number of present people for each area EA set by area definition table 32 B 0≤ X 1≤50 0≤ X 2+ X 3≤50 0≤ X 4+ X 5≤50 0≤ X 6+ X 7+ X 8 • Lower bound and upper bound of error term of assumed detection error range for each sensor S set by error term definition table 32 C −5≤ eps 11≤5 −10≤ eps 12≤9 −3≤ eps 21 eps 22≤2 • Constraint expression derived for each sensor S by error model definition table 32 D 28+ eps 11= X 1+ X 2+ X 8 21+ eps 12= X 3+ X 4 16+ eps 13= X 5+ X 6+ X 7 10+ eps 21= X 6 10+ eps 22= X 7+ X 8 • Upper bound and lower bound of number of present people that may be observed set for each sensor S by error model definition table 32 D 0≤28+ eps 11≤60 0≤21 +eps 12≤90 0≤16 +eps 13≤30
Through the processing above, the derivation unit 20 B derives the constraint expression, and setting information in which at least one of the lower bound and the upper bound of at least one of the variable X, the number of present people who may be present in the area EA, the error term, and the number of present people that may be observed by the sensor S is set.
Returning to , the description will be continued. The derivation unit 20 B outputs the derived constraint expression and the setting information to the range calculation unit 20 C.
The range calculation unit 20 C calculates a possible range of the number of present people in the area EA using the constraint expression derived by the derivation unit 20 B. In the present embodiment, the range calculation unit 20 C calculates the possible range of the number of present people for each of the areas EA using the constraint expression and the setting information received from the derivation unit 20 B.
Specifically, the range calculation unit 20 C calculates the possible range of the number of present people by calculating endpoints of the possible range of the number of present people by solving the mathematical optimization problem using the constraint expression.
is an explanatory diagram of an example of the possible range of the number of present people. The endpoints of the possible range of the number of present people are specified by a minimum endpoint and a maximum endpoint. That is, the possible range of the number of present people is a range represented by a range P from the minimum endpoint to the maximum endpoint as the endpoints.
The range calculation unit 20 C calculates the endpoints of the possible range of the number of present people for each of the areas EA using the range definition DB 34 for defining the minimum endpoint and the maximum endpoint of the possible range of the number of present people.
is a schematic diagram illustrating an example of a data configuration of the range definition DB 34 . The range definition DB 34 is a database that previously specifies an endpoint definition for a solution of the mathematical optimization problem.
The range definition DB 34 is a database in which the area ID and the endpoint definition are associated with each other. The area ID is the same as that described above.
The endpoint definition includes a definition of the minimum endpoint and a definition of the maximum endpoint. The definition of the minimum endpoint represents a definition of the minimum endpoint of the possible range of the number of present people in the area EA identified with a corresponding area ID. The definition of the maximum endpoint represents a definition of the maximum endpoint of the possible range of the number of present people in the area EA identified with a corresponding area ID.
In the endpoint definition, an optional definition is determined in advance for the solution obtained by solving the mathematical optimization problem using the setting information set by the derivation unit 20 B and the constraint expression. For example, as illustrated in , as definitions of the minimum endpoint, “minimum value”, “minimum value−1”, “minimum value−2”, “minimum value×0.8”, or the like are set in advance.
The “minimum value” set in the range definition DB 34 represents a solution obtained by solving a minimization problem using the setting information and the constraint expression by the range calculation unit 20 C. That is, “minimum value” as the definition of the minimum endpoint represents that a minimum value as the solution of the minimization problem is assumed to be the minimum endpoint. Additionally, “minimum value+K”, “minimum value−K”, or “minimum value×K” (K is a numerical value larger than 0) as the definition of the minimum endpoint represents that a value obtained by correcting the minimum value as the solution of the minimization problem using the expression represented by the definition is assumed to be the minimum endpoint.
For example, as illustrated in , “maximum value”, “maximum value+2”, “maximum value×1.5”, and the like are set in advance as definitions of the maximum endpoint. That is, “maximum value” as the definition of the maximum endpoint represents that a maximum value as a solution of a maximization problem is assumed to be the maximum endpoint. Additionally, “maximum value+K”, “maximum value−K”, or “maximum value×K” (K is a numerical value larger than 0) as the definition of the maximum endpoint represents that a value obtained by correcting the maximum value as the solution of the maximization problem using the expression represented by the definition is assumed to be the maximum endpoint.
Note that the expression representing the endpoint definition may be any expression using the maximum value or the minimum value as the solution of the mathematical optimization problem, and is not limited to the expression illustrated in .
The range calculation unit 20 C calculates the possible range of the number of present people for each of the areas EA using the constraint expression and the setting information received from the derivation unit 20 B, and the range definition DB 34 . Specifically, the range calculation unit 20 C calculates the endpoints of the possible range by solving the mathematical optimization problem that satisfies the constraint condition represented by the constraint expression, and maximizes and minimizes an objective function represented by the configuration of the variable X of the observation unit space included in the area EA.
Specifically, the range calculation unit 20 C solves the maximization problem that satisfies the constraint condition represented by the constraint expression and the setting information received from the derivation unit 20 B, and maximizes the objective function represented by the configuration of the variable X representing the number of present people in the area EA as a processing target. The range calculation unit 20 C then calculates the maximum value as the solution of the maximization problem by solving the maximization problem.
For example, assumed is a case of calculating the possible range of the number of present people for the area EA3. In this case, the range calculation unit 20 C solves the maximization problem that satisfies the constraint condition represented by the constraint expression and the setting information corresponding to the area EA, and maximizes a value of the number of present people represented by “X4+X5” as the configuration of the variables X of the area EA3. By solving this maximization problem, the maximum value described above as the solution of the maximization problem is calculated.
Specifically, the range calculation unit 20 C also solves the minimization problem that satisfies the constraint condition represented by the constraint expression and the setting information received from the derivation unit 20 B, and minimizes the objective function represented by the configuration of the variable X representing the number of present people in the area EA as a processing target. The range calculation unit 20 C then calculates the minimum value described above as the solution of the minimization problem by solving the minimization problem.
For example, assumed is a case of calculating the possible range of the number of present people for the area EA3. In this case, the range calculation unit 20 C solves the minimization problem that satisfies the constraint condition represented by the constraint expression and the setting information corresponding to the area EA, and minimizes a value of the objective function represented by “X4+X5” as the configuration of the variables X of the area EA2. By solving the minimization problem, the minimum value described above as the solution of the minimization problem is calculated.
The range calculation unit 20 C then derives the maximum endpoint of the possible range of the number of present people in accordance with the calculated maximum value as the solution of the maximization problem and the definition of the maximum endpoint specified in the range definition DB 34 . Similarly, the range calculation unit 20 C derives the minimum endpoint of the possible range of the number of present people in accordance with the calculated minimum value as the solution of the minimization problem and the definition of the minimum endpoint specified in the range definition DB 34 .
For example, assumed is a case in which the range calculation unit 20 C derives the maximum endpoint and the minimum endpoint of the possible range of the number of present people in the area EA3 using the range definition DB 34 illustrated in . In this case, the range calculation unit 20 C calculates a value obtained by adding “2” to the maximum value obtained by solving the maximization problem as the maximum endpoint of the possible range of the number of present people in the area EA3. The range calculation unit 20 C also calculates a value obtained by adding “−2” to the minimum value obtained by solving the minimization problem as the minimum endpoint of the possible range of the number of present people in the area EA3.
That is, the range calculation unit 20 C calculates, as the endpoints including the maximum endpoint and the minimum endpoint, values obtained by correcting solutions obtained by solving mathematical optimization problems on the basis of the predetermined endpoint definitions specified in the range definition DB 34 . In a case in which “minimum value” or “maximum value” representing that the solution of the mathematical optimization problem is assumed to be the endpoint is specified as the endpoint definition, the range calculation unit 20 C may use the solution of the mathematical optimization problem as the maximum endpoint or the minimum endpoint.
Similarly, the range calculation unit 20 C calculates the possible range of the number of present people for each of the areas EA by calculating the maximum endpoint and the minimum endpoint for each of the areas EA.
The range calculation unit 20 C then outputs the possible range of the number of present people represented by the maximum endpoint and the minimum endpoint calculated for each of the areas EA to the reliability calculation unit 20 D.
Returning to , the description will be continued.
The reliability calculation unit 20 D calculates reliability of the estimation value of the number of present people for each of the areas EA by using the possible range of the number of present people calculated for each of the areas EA by the range calculation unit 20 C.
For example, the reliability calculation unit 20 D assumes that a true value of the number of present people is present at any one of the minimum endpoint and the maximum endpoint of the possible range of the number of present people. The reliability calculation unit 20 D then calculates, as the reliability, an inverse number of a difference between the maximum endpoint and the minimum endpoint of the possible range of the number of present people. Specifically, the reliability calculation unit 20 D calculates the reliability using the following expression (A). Reliability=1/{(maximum endpoint−minimum endpoint)+1)} (A)
The reliability calculation unit 20 D may perform calculation assuming that the true value of the number of present people is present as any one of nonnegative integers between the minimum endpoint and the maximum endpoint represented by the possible range of the number of present people.
The reliability calculation unit 20 D may calculate, as the reliability, a value proportional to the difference between the maximum endpoint and the minimum endpoint of the possible range of the number of present people. Specifically, the reliability calculation unit 20 D may calculate, as the reliability, a range obtained by normalizing the possible range of the number of present people using a maximum range of the possible range of the number of present people.
The maximum range of the possible range of the number of present people is represented by a range from the lower bound to the upper bound corresponding to the area EA identified with the area ID in the area definition table 32 B illustrated in B . The reliability calculation unit 20 D may obtain the maximum range of the possible range of the number of present people for each of the areas EA to calculate the reliability by reading the setting information. Specifically, the reliability calculation unit 20 D may calculate the reliability using the following expression (B). Reliability={(upper bound−lower bound+1)−(maximum endpoint−minimum endpoint)}/(upper bound−lower bound+1) (B)
The upper bound and the lower bound in the expression (B) respectively represent values of the upper bound and the lower bound corresponding to the area ID in the area definition table 32 B (refer to B ).
The reliability calculation unit 20 D calculates the reliability by the calculation described above for each of all the areas EA included in the space MS as the observation target. The reliability calculation unit 20 D then outputs a reliability file 44 including the possible range of the number of present people and the reliability of each of all the areas EA.
is a schematic diagram illustrating an example of a data configuration of the reliability file 44 . The reliability file 44 is a table in which the area ID, the minimum endpoint, the maximum endpoint, and the reliability are associated with each other. The area ID is the same as that described above. The minimum endpoint and the maximum endpoint are the minimum endpoint and the maximum endpoint of the possible range of the number of present people calculated by the range calculation unit 20 C.
Returning to , the description will be continued. Next, the following describes the estimation unit 20 E.
The estimation unit 20 E estimates the number of present people in the area EA on the basis of the observation value. The estimation unit 20 E may estimate the number of present people in the area EA on the basis of the observation value by using a well-known method.
Specifically, the estimation unit 20 E acquires the observation value file 40 from the acquisition unit 20 A via the derivation unit 20 B. The estimation unit 20 E may directly acquire the observation value file 40 from the acquisition unit 20 A. The estimation unit 20 E then estimates the number of present people for each of the areas EA on the basis of the observation value by using a machine learning model such as regression, a neural network, and deep learning, or well-known estimation processing such as mathematical optimization. The estimation unit 20 E outputs an estimation value file 46 including an estimation value estimated for each of the areas EA.
is a schematic diagram illustrating an example of a data configuration of the estimation value file 46 . The estimation value file 46 is a table in which the area ID and the estimation value of the number of present people in the area EA identified with the area ID are associated with each other. exemplifies a table in which one area ID is associated with one estimation value to be registered. However, the estimation value file 46 may be a table in which one area ID is associated with the estimation values to be registered. For example, the estimation value file 46 may be a table in which one area ID is associated with estimation values of observation dates and times that are different from each other.
Next, the following describes an example of a procedure of information processing performed by the information processing device 10 according to the present embodiment.
is a flowchart illustrating an example of the procedure of information processing performed by the information processing device 10 according to the present embodiment.
The acquisition unit 20 A of the information processing device 10 acquires the observation value file 40 from the sensor S (Step S 100 ). The derivation unit 20 B performs constraint expression derivation processing for deriving the constraint expression for each of the areas EA on the basis of the observation value file 40 acquired at Step S 100 (Step S 102 ).
Next, the range calculation unit 20 C performs range calculation processing for calculating the possible range of the number of present people for each of the areas EA by using the constraint expression derived at Step S 102 (Step S 104 ).
Next, the reliability calculation unit 20 D performs reliability calculation processing for calculating the reliability of the estimation value of the number of present people for each of the areas EA by using the possible range of the number of present people calculated at Step S 104 (Step S 106 ).
Next, the estimation unit 20 E performs estimation processing for estimating the number of present people for each of the areas EA on the basis of the observation value file acquired at Step S 100 (Step S 108 ). This routine is then ended.
Next, the following describes an example of a procedure of the constraint expression derivation processing (Step S 102 in ) performed by the derivation unit 20 B.
is a flowchart illustrating an example of the procedure of the constraint expression derivation processing performed by the derivation unit 20 B.
The derivation unit 20 B reads the error model DB 32 from the storage unit 30 (Step S 200 ).
The derivation unit 20 B sets the upper bound and the lower bound of the number of present people to each of the variables X using the variable definition table 32 A included in the error model DB 32 read at Step S 200 (Step S 202 ).
Next, the derivation unit 20 B sets the upper bound and the lower bound of the number of present people for each of the areas EA using the area definition table 32 B included in the error model DB 32 read at Step S 200 (Step S 204 ).
The derivation unit 20 B also sets the lower bound and the upper bound for each error term of the sensor S using the error term definition table 32 C included in the error model DB 32 read at Step S 200 (Step S 206 ).
Next, the derivation unit 20 B acquires observation values of all of the sensors S included in the space MS as the observation target (Step S 208 ). The derivation unit 20 B acquires the observation values of all of the sensors S by reading the observation values included in the observation value file 40 received from the acquisition unit 20 A.
Next, the derivation unit 20 B reads the error model corresponding to each of the sensor IDs in the error model definition table 32 D included in the error model DB 32 read at Step S 200 . The derivation unit 20 B then derives the constraint expression by substituting the observation value acquired at Step S 208 for the term of the observation value variable included in the error model of the corresponding sensor S (Step S 210 ).
Through the processing at Step S 210 , the derivation unit 20 B derives the constraint expression for each of the sensors S.
The derivation unit 20 B then sets the lower bound and the upper bound to the error model representing the constraint expression using any of the left side and the right side of the constraint expression derived at Step S 210 (Step S 212 ).
The setting information set through the processing at Step S 202 to Step S 206 and Step S 212 , and the constraint expression derived at Step S 210 are output to the range calculation unit 20 C (Step S 214 ). This routine is then ended.
Next, the following describes an example of a procedure of range calculation processing (refer to Step S 104 in ) performed by the range calculation unit 20 C.
is a flowchart illustrating an example of the procedure of the range calculation processing performed by the range calculation unit 20 C.
The range calculation unit 20 C reads the range definition DB 34 from the storage unit 30 (Step S 300 ).
Next, the range calculation unit 20 C performs the processing at Step S 302 to Step S 308 for each of the areas EA included in the space MS as the observation target.
Specifically, the range calculation unit 20 C calculates a solution of the maximization problem of the number of present people in the area EA as a processing target using the constraint expression derived by the derivation unit 20 B (Step S 302 ). Specifically, the range calculation unit 20 C calculates the solution of the maximization problem that satisfies the constraint condition represented by the constraint expression and the setting information received from the derivation unit 20 B, and maximizes the objective function represented by the configuration of the variable X representing the number of present people in the area EA as a processing target.
The range calculation unit 20 C also calculates a solution of the minimization problem of the number of present people in the area EA as a processing target using the constraint expression derived by the derivation unit 20 B (Step S 304 ). Specifically, the range calculation unit 20 C also calculates a solution of the minimization problem that satisfies the constraint condition represented by the constraint expression and the setting information received from the derivation unit 20 B, and minimizes the objective function represented by the configuration of the variable X representing the number of present people in the area EA as a processing target.
Next, by using the maximum value as the solution of the maximization problem calculated at Step S 302 and the definition of the maximum endpoint specified in the range definition DB 34 , the range calculation unit 20 C derives the maximum endpoint of the possible range of the number of present people in accordance with the definition (Step S 306 ).
By using the minimum value as the solution of the minimization problem calculated at Step S 304 and the definition of the minimum endpoint specified in the range definition DB 34 , the range calculation unit 20 C derives the minimum endpoint of the possible range of the number of present people in accordance with the definition (Step S 308 ).
After performing the processing at Step S 302 to Step S 308 for each of the areas EA included in the space MS as the observation target, the range calculation unit 20 C advances the process to Step S 310 . At Step S 310 , the range calculation unit 20 C outputs, to the reliability calculation unit 20 D, the possible range of the number of present people in each of all the areas EA included in the space MS as the observation target derived by repeatedly performing the processing at Step S 302 to Step S 308 (Step S 310 ). This routine is then ended.
Next, the following describes an example of a procedure of the reliability calculation processing (Step S 106 in ) performed by the reliability calculation unit 20 D.
is a flowchart illustrating an example of the procedure of the reliability calculation processing performed by the reliability calculation unit 20 D.
The reliability calculation unit 20 D calculates the reliability of the estimation value of the number of present people for each of the areas EA using the possible range of the number of present people calculated by the range calculation unit 20 C (Step S 400 ).
The reliability calculation unit 20 D then outputs the reliability file 44 including the reliability calculated for each of all the areas EA included in the space MS as the observation target and the possible range of the number of present people received from the range calculation unit 20 C (Step S 402 ). This routine is then ended.
As described above, the information processing device 10 according to the present embodiment includes the acquisition unit 20 A, the derivation unit 20 B, the range calculation unit 20 C, and the reliability calculation unit 20 D. The acquisition unit 20 A acquires observation values of the number of present people from one or more sensors S disposed in at least part of one or more areas EA. The derivation unit 20 B derives, for each of the sensors S, the constraint expression obtained by substituting the acquired observation value for the term of the observation value variable included in the error model. The error model is a model representing correspondence between the number of present people in the observation range of the sensor S represented by the observation value variable of the observation value and the error term related to the assumed detection error range of the sensor S, and the number of present people in the observation range of the sensor S represented by the variable X representing the number of present people in the observation unit space that is determined by the observation range of the sensor S and the range of the area EA. The range calculation unit 20 C calculates the possible range of the number of present people in the area EA using the constraint expression. The reliability calculation unit calculates the reliability of the estimation value of the number of present people for each of the areas EA using the possible range of the number of present people.
In this way, the information processing device 10 according to the present embodiment calculates the reliability of the estimation value of the number of present people in the area EA on the basis of the observation value and the constraint expression without using the estimation value of the number of present people. That is, the information processing device 10 according to the present embodiment calculates the reliability of the estimation value of the number of present people in the area EA using independent logic different from estimation logic for the number of present people.
Therefore, the information processing device 10 according to the present embodiment can calculate the reliability of the estimation value with high accuracy even in a case in which an assumption used for the estimation logic for the number of present people is different from an event in a real environment.
Accordingly, the information processing device 10 according to the present embodiment can calculate the reliability of the estimation value of the number of present people in the area EA with high accuracy.
The information processing device 10 according to the present embodiment calculates the possible range of the number of present people for each of the areas EA using the constraint expression obtained by substituting the acquired observation value for the term of the observation value variable included in the error model, and calculates the reliability of the estimation value of the number of present people for each of the areas EA using the calculated possible range. The error model is a model representing correspondence between the number of present people in the observation range of the sensor S represented by the observation value variable of the observation value and the error term related to the assumed detection error range of the sensor S, and the number of present people in the observation range of the sensor S represented by the variable X representing the number of present people in the observation unit space that is determined by the observation range of the sensor S and the range of the area EA. That is, the error model is a model representing the assumed detection error range represented by the error term using the number of present people represented by the observation value variable and the variable X.
Thus, the information processing device 10 according to the present embodiment can calculate the possible range of the number of present people in the area EA assuming the assumed detection error range of the sensor S using the constraint expression, and calculate the reliability of the estimation value of the number of present people in the area EA on the basis of the possible range.
Accordingly, the information processing device 10 according to the present embodiment can calculate the reliability of the estimation value of the number of present people in the area with high accuracy.
Second Embodiment
The present embodiment describes a form of calculating the possible range of the number of present people using a method different from that in the embodiment described above.
is a schematic diagram of an example of an information processing system 1 B according to the present embodiment.
The information processing system 1 B includes the sensor S and an information processing device 10 B. The information processing device 10 B and the sensor S are connected to each other in a communicable manner. The sensor S is the same as that in the embodiment described above.
The information processing device 10 B includes a processing unit 21 and the storage unit 30 . The processing unit 21 and the storage unit 30 are connected to each other in a communicable manner via a bus and the like.
The storage unit 30 stores the error model DB 32 , the range definition DB 34 , and a priority definition DB 36 . The error model DB 32 and the range definition DB 34 are the same as those described above.
The priority definition DB 36 is information specifying a weight value for the sensor S. The priority definition DB 36 corresponds to priority definition information.
Specifically, the priority definition DB 36 is a database in which a combination of weight values is specified in advance for each combination of groups to which the sensors S belong.
A and B are schematic diagrams illustrating an example of a data configuration of the priority definition DB 36 . The priority definition DB 36 includes a group definition list group 36 A and a weight definition table 36 B.
A is a schematic diagram illustrating an example of a data configuration of the group definition list group 36 A. As illustrated in A , the sensors S included in the space MS as the observation target are classified into two or more groups in accordance with a condition determined in advance. The same weight value is specified for the sensors S belonging to the same group. A exemplifies a state in which the sensors S are classified according to the types of the sensors S. A group ID for identifying the group is given to each of the groups in advance.
B is a schematic diagram illustrating an example of a data configuration of the weight definition table 36 B. The weight definition table 36 B is a table in which a combination of different weight values is set in advance for each combination of the groups to which the sensors S belong. The weight value is information representing a weight for the observation value of the sensor S.
B exemplifies a case in which K combinations of weight values are set. K is an integral number equal to or larger than 1.
Returning to , the description will be continued. The processing unit 21 performs information processing in the information processing device 10 B. The processing unit 21 includes the acquisition unit 20 A, the derivation unit 20 B, a range calculation unit 21 C, a reliability calculation unit 21 D, and the estimation unit 20 E. The acquisition unit 20 A, the derivation unit 20 B, and the estimation unit 20 E are the same as those in the first embodiment described above.
Similarly to the range calculation unit 20 C in the embodiment described above, the range calculation unit 21 C calculates the possible range of the number of present people in the area EA using the constraint expression derived by the derivation unit 20 B.
In the present embodiment, on the basis of the priority definition DB 36 , the range calculation unit 21 C obtains estimation information about the number of present people for each combination of the weight values by solving a mathematical optimization problem of an objective function that satisfies the constraint condition represented by the constraint expression, and is specified by the error term and the K combinations of the weight values specified in the priority definition DB 36 . The estimation information is a value obtained by estimating the number of present people, that is, a value representing the number of people. The range calculation unit 21 C then calculates the possible range of the number of present people using the estimation information about the number of present people obtained for each combination of the weight values.
Specifically, the range calculation unit 21 C sets the objective function represented by the following expression (C) for each of the K combinations of the weight values specified in the weight definition table 36 B.
arg min ∑ g ∈ G Wg ∑ j = 1 pg f ( epsg ) j ( C )
In the expression (C) described above, g represents the group ID. Wg represents the weight value of the group identified with the group ID “g” in the weight definition table 36 B. epsgj represents the error term, that is, the error term of the j-th sensor S of the group identified with the group ID “g” in the group definition list group 36 A. pg represents the number of the sensors S belonging to the group identified with the group ID “g”. f represents a function for converting the error term into a square error or an absolute value.
For each of the areas EA and for each of the K combinations of the weight values specified in the weight definition table 36 B, the range calculation unit 21 C substitutes the weight value “Wg” of each group included in the combination for the objective function using the error term represented by the expression (C) described above. The range calculation unit 21 C solves the mathematical optimization problem of the objective function represented by the expression (C) described above for which the weight value is substituted. At this point, the range calculation unit 21 C solves the mathematical optimization problem of the objective function using the constraint expression and the setting information derived by the derivation unit 20 B as the constraint condition.
Through the processing above, the range calculation unit 21 C obtains the estimation information about the number of present people corresponding to each of the K combinations of the weight values for each of the areas EA.
The range calculation unit 21 C then derives the maximum endpoint and the minimum endpoint of the number of present people in accordance with a definition specified in the range definition DB 34 using the estimation information about the number of present people corresponding to each of the K combinations of the weight values obtained for each of the areas EA. That is, the range calculation unit 21 C calculates, for each of the areas EA, the possible range of the number of present people specified by the maximum endpoint and the minimum endpoint. The range calculation unit 21 C then outputs, to the reliability calculation unit 21 D, the possible range of the number of present people specified by the maximum endpoint and the minimum endpoint.
Alternatively, in place of the maximum endpoint and the minimum endpoint, the range calculation unit 21 C may output, to the reliability calculation unit 21 D, variation in the estimation information about the number of present people obtained for each combination of the weight values as the possible range.
In this case, the range calculation unit 21 C may output a simulation table as the possible range to the reliability calculation unit 21 D. The simulation table is a table representing, for each of the areas EA, the variation in the estimation information as the estimation information about the number of present people obtained for each of the K combinations of the weight values.
is a schematic diagram illustrating an example of a data configuration of a simulation table 38 . The simulation table 38 is a table in which the area ID and the estimation information about the number of present people obtained for each of the K combinations of the weight values are associated with each other. In , a simulation to a simulation K are pieces of identification information of the K combinations of the weight values, respectively. The range calculation unit 21 C may output, to the reliability calculation unit 21 D, the simulation table 38 as the variation in the estimation information about the number of present people in each of the areas EA, that is, the possible range.
In a case of using the simulation table 38 as the possible range of the number of present people, the minimum endpoint and the maximum endpoint of the possible range are not required to be set. Thus, in this case, “NA” representing that there is no set value may be set for the definition of the minimum endpoint and the definition of the maximum endpoint indicated in the endpoint definition in the range definition DB 34 .
Returning to , the description will be continued. In a case of acquiring the possible range of the number of present people specified by the maximum endpoint and the minimum endpoint from the range calculation unit 21 C, the reliability calculation unit 21 D calculates the reliability of the estimation value of the number of present people for each of the areas EA using the possible range of the number of present people similarly to the reliability calculation unit 20 D in the embodiment described above.
On the other hand, in a case of acquiring the possible range of the number of present people specified by the simulation table 38 from the range calculation unit 21 C, the reliability calculation unit 21 D calculates the reliability of the estimation value of the number of present people for each of the areas EA through the following processing.
Specifically, the reliability calculation unit 21 D reads the variation in the estimation information as the estimation information about the number of present people obtained for each of the K combinations of the weight values corresponding to the area ID of the area EA for each of the areas EA specified by the simulation table 38 .
The reliability calculation unit 21 D then calculates, for each of the areas EA, a variance or a standard deviation representing the variation in the estimation information represented by pieces of the estimation information on the basis of the estimation information about the number of present people corresponding to each of the read K combinations of the weight values. The reliability calculation unit 21 D then calculates, as the reliability, an inverse number of the variation in the estimation information. Specifically, the reliability calculation unit 21 D calculates the reliability for each of the areas EA by the following expression (D) or expression (E). Reliability=1/variance (D) Reliability=1/standard deviation (E)
In the expression (D), “variance” is a variance representing the variation in the estimation information about the number of present people corresponding to each of the read K combinations of the weight values. In the expression (E), “standard deviation” is a standard deviation representing the variation in the estimation information about the number of present people corresponding to each of the read K combinations of the weight values.
Alternatively, the reliability calculation unit 21 D may calculate, as the reliability, a value proportional to a difference between a maximum value and a minimum value of the estimation information represented by the variation in the number of present people corresponding to each of the K combinations of the weight values. In this case, the reliability calculation unit 21 D may calculate the reliability for each of the areas EA using the following expression (F). Reliability={(maximum value−minimum value+1)−(standard deviation)}/(maximum value−minimum value+1) (F)
In a case in which the reliability calculation unit 21 D acquires the possible range of the number of present people specified by the simulation table 38 from the range calculation unit 21 C, the reliability calculation unit 21 D may output the reliability file 44 having the following data configuration in place of the reliability file 44 having the data configuration illustrated in .
Specifically, the reliability calculation unit 21 D may output, as the reliability file 44 , a file in which a field of specifying the reliability is added to the simulation table 38 , and the reliability calculated for the area EA identified with the area ID is registered in the field.
Next, the following describes an example of a procedure of range calculation processing (refer to Step S 104 in ) performed by the range calculation unit 21 C of the information processing device 10 B according to the present embodiment.
is a flowchart illustrating an example of the procedure of the range calculation processing performed by the range calculation unit 21 C.
The range calculation unit 20 C reads the range definition DB 34 from the storage unit 30 (Step S 500 ). The range calculation unit 20 C also reads the priority definition DB 36 from the storage unit 30 (Step S 502 ).
Next, for each of the areas EA included in the space MS as the observation target, the range calculation unit 20 C performs the processing at Step S 504 and Step S 506 for each of the K combinations of the weight values specified in the priority definition DB 36 read at Step S 502 .
Specifically, the range calculation unit 20 C sets the objective function represented by the expression (C) described above for each of the K combinations of the weight values specified in the weight definition table 36 B of the priority definition DB 36 read at Step S 502 (Step S 504 ).
The range calculation unit 20 C then obtains the estimation information about the number of present people for each of the areas EA by solving the mathematical optimization problem of the objective function set at Step S 504 (Step S 506 ). At this point, the range calculation unit 21 C solves the mathematical optimization problem of the objective function using the constraint expression and the setting information derived by the derivation unit 20 B as the constraint condition.
By repeatedly performing the processing at Step S 504 to S 506 , the range calculation unit 20 C calculates, for each of the areas EA included in the space MS as the observation target, the estimation information about the number of present people for each of the K combinations of the weight values specified in the priority definition DB 36 .
Next, in accordance with the definition specified in the range definition DB 34 read at Step S 502 , the range calculation unit 20 C calculates the maximum endpoint and the minimum endpoint of the number of present people using the estimation information about the number of present people calculated by the processing at Step S 504 to Step S 506 (Step S 508 ). That is, the range calculation unit 21 C calculates, for each of the areas EA, the possible range of the number of present people specified by the maximum endpoint and the minimum endpoint.
The range calculation unit 21 C then outputs, to the reliability calculation unit 21 D, the possible range of the number of present people specified by the maximum endpoint and the minimum endpoint (Step S 510 ). This routine is then ended.
Next, the following describes an example of a procedure of the reliability calculation processing (refer to Step S 106 in ) performed by the reliability calculation unit 21 D.
is a flowchart illustrating an example of the procedure of the reliability calculation processing performed by the reliability calculation unit 21 D. exemplifies an example of the procedure of the processing in a case in which the reliability calculation unit 21 D acquires the simulation table 38 as the possible range from the range calculation unit 20 C.
The reliability calculation unit 21 D performs processing at Step S 600 for each of the areas EA included in the space MS as the observation target.
At Step S 600 , the reliability calculation unit 21 D reads the variation in the estimation information as the estimation information about the number of present people obtained for each of the K combinations of the weight values corresponding to the area ID of the area EA for each of the areas EA specified by the simulation table 38 .
The reliability calculation unit 21 D then calculates, for each of the areas EA, a variance or a standard deviation representing the variation in the estimation information represented by pieces of the estimation information on the basis of the estimation information about the number of present people corresponding to each of the read K combinations of the weight values. The reliability calculation unit 21 D then calculates the reliability using the calculated variance or standard deviation, and the expression (D) or the expression (E) described above.
The reliability calculation unit 21 D then outputs the reliability file 44 in which a field of defining the reliability is added to the simulation table 38 , and the reliability calculated at Step S 600 is registered in the field (Step S 602 ). This routine is then ended.
As described above, in the present embodiment, the range calculation unit 21 C of the information processing device 10 B obtains the estimation information about the number of present people for each of the areas EA by solving the mathematical optimization problem of the objective function that satisfies the constraint condition represented by the constraint expression, and is defined by the error term and the combination of the weight values corresponding to the combination of the groups to which the sensors S belong on the basis of the priority definition DB 36 . The range calculation unit 21 C then calculates the possible range of the number of present people using the estimation information about the number of present people obtained for each of the areas EA.
In this way, the information processing device 10 B according to the present embodiment calculates the possible range of the number of present people in accordance with the priority represented by the combination of the weight values of the groups to which the sensors S belong.
That is, the information processing device 10 B according to the present embodiment calculates the possible range of the number of present people on the basis of the weight values corresponding to the type and the like of the sensor S. Thus, the information processing device 10 B according to the present embodiment can calculate the reliability with higher accuracy in addition to the effect of the embodiment described above.
First Modification
The above embodiments exemplify the form of using the error model directly specifying the variable X representing the number of present people in the observation unit space.
The information processing device 10 and the information processing device 10 B according to the embodiments described above may use an error model representing the number of present people in the observation range of the sensor S represented by the variable X using an area ratio of the area EA included in the observation range of the sensor S.
In this case, the storage unit 30 may be configured to store an error model DB 33 illustrated in A to C in advance in place of the error model DB 32 described above.
A to C are schematic diagrams illustrating examples of a data configuration of the error model DB 33 . For example, the error model DB 33 includes an area definition table 33 B, an error term definition table 33 C, and an error model definition table 33 D.
A is a schematic diagram illustrating an example of a data configuration of the area definition table 33 B. The area definition table 33 B is a table defining the configuration of the variables X in the observation unit space included in the area EA, and the lower bound and the upper bound of the number of present people for each pf the areas EA included in the space MS as the observation target. The area ID, the lower bound, and the upper bound in the area definition table 33 B are the same as those in the area definition table 32 B in the embodiment described above.
In a field of a configuration of the variable X in the area definition table 33 B, a variable An representing the number of present people in the area EA identified with a corresponding area ID is set. n is an integral number equal to or larger than 1, and identical with a number of the area ID. That is, in fields of the configuration in the area definition table 33 B, a variable A1 to a variable A4 are set, which correspond to the areas EA1 to EA4, respectively.
B is a schematic diagram illustrating an example of a data configuration of the error term definition table 33 C. The error term definition table 33 C is the same as the error term definition table 32 C according to the embodiment described above.
C is a schematic diagram illustrating an example of a data configuration of the error model definition table 33 D. The error model definition table 33 D is a table specifying a format of the constraint expression for each of the sensors S included in the space MS as the observation target similarly to the error model definition table 32 D in the embodiment described above.
Specifically, the error model definition table 33 D is a table in which the sensor ID, the observation value variable, the error model, the upper bound, and the lower bound are associated with each other. The sensor ID, the observation value variable, the lower bound, and the upper bound are the same as those in the error model definition table 32 D in the embodiment described above.
The error model in the error model definition table 33 D is a model representing the format of the constraint expression. Similarly to the embodiment described above, the error model is a model including the observation value variable of the observation value, and specifying a relation between the variable X and the error term related to the assumed detection error range of the sensor S for each of the sensor S. However, in the present embodiment, the error model in the error model definition table 33 D is a model representing the number of present people in the observation range of the sensor S represented by the variable X using the area ratio of the area EA included in the observation range.
Specifically, as illustrated in C , a right side of an expression representing the error model represents the number of present people in the observation range of the sensor S represented by the variable X that represents the number of present people in the observation unit space using the variable An of the number of present people corresponding to the area ratio of the area EA included in the observation range of the sensor S.
That is, in the present modification, on the assumption that “distribution of the number of present people in the area EA is proportional to the area”, the number of present people in the observation range of the sensor S is represented by the variable An of the number of present people corresponding to the area ratio of the area EA constituting the observation range of the sensor S.
The derivation unit 20 B may derive the constraint expression similarly to the embodiment described above except that the error model DB 33 is used in place of the error model DB 32 .
That is, the derivation unit 20 B may derive the constraint expression by substituting the observation value acquired by the acquisition unit 20 A for the term of the observation value variable included in the error model specified in the error model definition table 33 D. The derivation unit 20 B may derive the setting information similarly to the embodiment described above by using the error model DB 33 in place of the error model DB 32 .
In this way, in the present modification, on the assumption that “distribution of the number of present people in the area EA is proportional to the area”, used is the error model representing the number of present people in the observation range of the sensor S represented by the variable X using the area ratio of the area EA included in the observation range. Thus, in the present modification, the number of variables set for the mathematical optimization problem can be reduced as compared with the embodiment described above. Thus, in the present modification, the reliability of the estimation value of the number of present people can be calculated with a low load and high accuracy in addition to the effect of the embodiments described above.
Third Embodiment
The present embodiment describes a form of correcting the possible range of the number of present people in accordance with the estimation value of the number of present people calculated by the estimation unit 20 E.
is a schematic diagram of an example of an information processing system 1 C according to the present embodiment.
The information processing system 1 C includes the sensor S and an information processing device 10 C. The information processing device 10 C and the sensor S are connected to each other in a communicable manner. The sensor S is the same as that in the embodiments described above.
The information processing device 10 C includes a processing unit 23 and the storage unit 30 . The processing unit 23 and the storage unit 30 are connected to each other in a communicable manner via a bus and the like. The storage unit 30 is the same as that in the first embodiment described above.
The processing unit 23 performs information processing in the information processing device 10 C. The processing unit 23 includes the acquisition unit 20 A, the derivation unit 20 B, a range calculation unit 23 C, the reliability calculation unit 20 D, and the estimation unit 20 E. The acquisition unit 20 A, the derivation unit 20 B, the reliability calculation unit 20 D, and the estimation unit 20 E are the same as those in the first embodiment described above.
Similarly to the range calculation unit 20 C in the embodiment described above, the range calculation unit 23 C calculates the possible range of the number of present people in the area EA using the constraint expression derived by the derivation unit 20 B.
Moreover, in the present embodiment, the range calculation unit 23 C acquires the estimation value of the number of present people estimated by the estimation unit 20 E, and if the estimation value is out of the possible range, corrects the possible range by the estimation value.
Specifically, the range calculation unit 23 C acquires the estimation value file 46 output from the estimation unit 20 E. Similarly to the range calculation unit 20 C in the embodiment described above, the range calculation unit 23 C calculates a maximum value as a solution of the maximization problem of the number of present people in the area EA as a processing target using the constraint expression derived by the derivation unit 20 B. Similarly to the range calculation unit 20 C in the embodiment described above, the range calculation unit 23 C also calculate a minimum value as a solution of the minimization problem of the number of present people in the area EA as a processing target using the constraint expression derived by the derivation unit 20 B.
Furthermore, the range calculation unit 23 C also performs correction processing for correcting each of the calculated maximum value and minimum value using the estimation value of the area EA as the processing target indicated by the estimation value file 46 .
Specifically, in a case in which the estimation value of the area EA as the processing target indicated by the estimation value file 46 is out of a range from the minimum value as the solution of the minimization problem to the maximum value as the solution of the maximization problem, the range calculation unit 23 C replaces at least one of the minimum value and the maximum value with the estimation value so that the estimation value is included in the range.
Specifically, in a case in which the estimation value of the area EA as the processing target indicated by the estimation value file 46 is smaller than the calculated minimum value as the solution of the minimization problem, the range calculation unit 23 C replaces the minimum value with the estimation value. In a case in which the estimation value of the area EA as the processing target indicated by the estimation value file 46 is larger than the calculated maximum value as the solution of the maximization problem, the range calculation unit 23 C replaces the maximum value with the estimation value.
Through this processing, the range calculation unit 23 C corrects the maximum value and the minimum value that are obtained by solving the mathematical optimization problem using the estimation value of the number of present people estimated by the estimation unit 20 E.
Note that, when the estimation value is a value within the range from the minimum value as the solution of the minimization problem to the maximum value as the solution of the maximization problem, each of the minimum value and the maximum value may be used as a corrected value.
By adjusting the corrected maximum value and minimum value in accordance with the definition specified in the range definition DB 34 similarly to the range calculation unit 20 C in the embodiment described above, the range calculation unit 23 C may calculate the maximum endpoint and the minimum endpoint of the possible range of the number of present people.
Next, the following describes an example of a procedure of information processing performed by the information processing device 10 C according to the present embodiment.
is a flowchart illustrating an example of the procedure of the information processing performed by the information processing device 10 C according to the present embodiment.
The acquisition unit 20 A of the information processing device 10 C acquires the observation value file 40 from the sensor S (Step S 700 ). The processing at Step S 700 is the same as that at Step S 100 described above (refer to ).
Next, the derivation unit 20 B performs constraint expression derivation processing for deriving the constraint expression for each of the areas EA on the basis of the observation value file 40 acquired at Step S 700 (Step S 702 ). The processing at Step PS 702 is the same as that at Step S 102 described above (refer to ).
Next, the estimation unit 20 E performs estimation processing for estimating the number of present people for each of the areas EA on the basis of the observation value file acquired at Step S 700 (Step S 710 ). The processing at Step S 710 is the same as that at Step S 108 described above (refer to ).
Next, the range calculation unit 23 C performs range calculation processing for calculating the possible range of the number of present people for each of the areas EA by using the constraint expression derived at Step S 702 and the estimation value file 46 estimated at Step S 710 (Step S 712 ). Details about the processing at Step S 712 will be described later.
Next, the reliability calculation unit 20 D calculates the reliability of the estimation value of the number of present people for each of the areas EA by using the possible range of the number of present people calculated at Step S 712 (Step S 714 ). The processing at Step S 714 is the same as that at Step S 106 described above (refer to ). This routine is then ended.
Next, the following describes an example of a procedure of the range calculation processing (refer to Step S 712 in ) performed by the range calculation unit 23 C of the information processing device 10 C according to the present embodiment.
is a flowchart illustrating an example of the procedure of the range calculation processing performed by the range calculation unit 23 C.
The range calculation unit 23 C reads the range definition DB 34 from the storage unit 30 (Step S 800 ). The range calculation unit 23 C also acquires the estimation value file 46 from the estimation unit 20 E (Step S 802 ).
Next, the range calculation unit 23 C repeatedly performs the processing at Step S 804 to Step S 812 for each of the areas EA included in the space MS as the observation target.
Specifically, the range calculation unit 23 C calculates the maximum value as the solution of the maximization problem of the number of present people in the area EA as the processing target using the constraint expression derived by the derivation unit 20 B (Step S 804 ). The range calculation unit 23 C also calculates the minimum value as the solution of the minimization problem of the number of present people in the area EA as the processing target using the constraint expression derived by the derivation unit 20 B (Step S 806 ). Pieces of the processing at Step S 804 and Step S 806 are the same as those at Step S 302 and Step S 304 described above (refer to ).
Moreover, the range calculation unit 23 C performs correction processing for correcting each of the maximum value and the minimum value calculated at Step S 804 and Step S 806 using the estimation value of the area EA as the processing target indicated by the estimation value file 46 (Step S 808 ).
is a flowchart illustrating an example of a procedure of correction processing at Step S 808 (refer to ).
The range calculation unit 23 C determines whether the estimation value of the number of present people in the area EA as the processing target indicated by the estimation value file 46 acquired at Step S 802 is smaller than the minimum value as the solution of the minimization problem calculated at Step S 806 (Step S 900 ). If negative determination is made at Step S 900 (No at Step S 900 ), the process proceeds to Step S 904 described later. If positive determination is made at Step S 900 (Yes at Step S 900 ), the process proceeds to Step S 902 .
At Step S 902 , the minimum value as the solution of the minimization problem calculated at Step S 806 is replaced with the estimation value of the number of present people in the area EA as the processing target indicated by the estimation value file 46 acquired at Step S 802 (Step S 902 ).
Next, the range calculation unit 23 C determines whether the estimation value of the number of present people in the area EA as the processing target indicated by the estimation value file 46 acquired at Step S 802 is larger than the maximum value as the solution of the maximization problem calculated at Step S 804 (Step S 904 ). If negative determination is made at Step S 904 (No at Step S 904 ), this routine is ended. If positive determination is made at Step S 904 (Yes at Step S 904 ), the process proceeds to Step S 906 .
At Step S 906 , the maximum value as the solution of the maximization problem calculated at Step S 804 is replaced with the estimation value of the number of present people in the area EA as the processing target indicated by the estimation value file 46 acquired at Step S 802 (Step S 906 ). This routine is then ended.
Note that, when the minimum value as the solution of the minimization problem is equal to or smaller than the estimation value, and the maximum value as the solution of the maximization problem is equal to or larger than the estimation value, each of the maximum value and the minimum value as calculated solutions may be used as a corrected value.
Returning to , the description will be continued. Next, by using the maximum value subjected to the correction processing at Step S 808 and the definition of the maximum endpoint specified in the range definition DB 34 , the range calculation unit 23 C derives the maximum endpoint of the possible range of the number of present people in accordance with the definition (Step S 810 ). Additionally, by using the minimum value subjected to the correction processing at Step S 808 and the definition of the minimum endpoint specified in the range definition DB 34 , the range calculation unit 23 C derives the minimum endpoint of the possible range of the number of present people in accordance with the definition (Step S 812 ).
After performing the processing at Step S 804 to Step S 812 for each of the areas EA included in the space MS as the observation target, the range calculation unit 23 C advances the process to Step S 814 . At Step S 814 , the range calculation unit 23 C outputs, to the reliability calculation unit 20 D, the possible range of the number of present people in each of all the areas EA included in the space MS as the observation target derived by repeatedly performing the processing at Step S 804 to Step S 812 (Step S 814 ). This routine is then ended.
As described above, in the information processing device 10 C according to the present embodiment, the range calculation unit 23 C acquires the estimation value of the number of present people estimated by the estimation unit 20 E, and if the estimation value is out of the possible range of the number of present people calculated by the range calculation unit 23 C, corrects the possible range by the estimation value.
Therefore, the information processing device 10 C according to the present embodiment can calculate the reliability of the estimation value of the number of present people in the area EA with higher accuracy in addition to the effect of the embodiment described above.
Second Modification
The above embodiments exemplify the form of using the error model directly specifying the variable X representing the number of present people in the observation unit space.
An error model using an integrated variable, which is obtained by integrating at least part of the variables X of the observation unit spaces included in the observation space of the sensor S, may be used.
In a case in which there is linear dependence among the variables X of some of the observation unit spaces included in the observation space of the sensor S, a value of the solution may vary depending on a solution method for mathematical optimization. Specifically, with a solution method of searching a solution space from an end thereof such as a barrier method, values are biased to any one of the variables X among which linear dependence is present, and all other values become 0. However, with a solution method of searching the solution space from a middle point thereof such as a primal-dual interior point method, values are equally distributed to the variables X among which linear dependence is present. Thus, there is the problem that a total value of solutions of the variables X among which linear dependence is present is the same, but respective solutions of the variables X among which linear dependence is present are different depending on the solution method for mathematical optimization.
is an explanatory diagram of an example of an integrated variable Z. illustrates a schematic diagram of the space MS as the observation target that is the same as that in the embodiment described above. assumes a case in which the variable X1 and the variable X2 of the respective observation unit spaces present in the observation space of the sensor S11 are integrated to be treated as an integrated variable Z1. The integrated variable Z1 is an example of the integrated variable Z.
The observation unit space of the variable X1 and the observation unit space of the variable X2 are spaces that are present within the observation space of the sensor S11 and adjacent to each other in the observation space. In the present modification, among the observation unit spaces present within the observation space of at least one of the sensors S, the variables X of adjacent observation unit spaces are integrated and treated as the integrated variable Z. Specifically, as an example of the variables X among which linear dependence is present, at least two variables X, the sensor IDs of which including the observation unit spaces of the variables are completely identical with each other, are integrated to be one variable (integrated variable Z).
In this case, the storage unit 30 may be configured to store an error model DB 35 illustrated in A to C in advance in place of the error model DB 32 described above.
A to C are schematic diagrams illustrating an example of a data configuration of the error model DB 35 . For example, the error model DB 35 includes a variable definition table 35 A, an area definition table 32 B, an error term definition table 32 C, an integrated variable definition table 35 E, and an error model definition table 35 D. The area definition table 32 B and the error term definition table 32 C are the same as those in the embodiment described above, so that they are not illustrated again.
A is a schematic diagram illustrating an example of a data configuration of the variable definition table 35 A. The variable definition table 35 A is a table in which a variable name, a lower bound, an upper bound, and a ratio of each of the observation unit spaces included in the space MS as the observation target are associated with each other. The variable name, the lower bound, and the upper bound in the variable definition table 35 A are the same as the variable name, the lower bound, and the upper bound in the variable definition table 32 A described in the above embodiment (refer to A ).
The ratio is information representing a distribution ratio at the time of distributing a range of the number of present people that is calculated for each observation range of the sensor S using the integrated variable Z to each of the observation unit spaces corresponding to the variable X included in the integrated variable Z. As the ratio, used are an area ratio, a statistical ratio of the number of present people in the past, a ratio on the basis of an empirical rule, and the like. A exemplifies a form of using the area ratio as the ratio.
B is a schematic diagram illustrating an example of a data configuration of the integrated variable definition table 35 E. The integrated variable definition table 35 E is a table specifying a definition of the integrated variable Z. Specifically, the integrated variable definition table 35 E is a table in which an integrated variable name, a lower bound, an upper bound, and a configuration variable are associated with each other.
The integrated variable name is identification information for the integrated variable Z included in the space MS as the observation target. A exemplifies Z1 as a name of the integrated variable Z1. The lower bound in the integrated variable definition table 35 E represents a lower limit value of the number of present people represented by the integrated variable Z identified with a corresponding integrated variable name. The upper bound in the integrated variable definition table 35 E represents an upper limit value of the number of present people represented by the integrated variable Z identified with a corresponding integrated variable name.
As the lower bound and the upper bound in the integrated variable definition table 35 E, an added value of lower bounds of the variables X before integration and an added value of upper bounds of the variables X before integration may be respectively set. The lower bound in the integrated variable definition table 35 E may be “NA” in a case in which “NA” is set to the lower bounds of the variables X before integration. The upper bound in the integrated variable definition table 35 E may be “NA” in a case in which “NA” is set to the upper bounds of the variables X before integration.
The configuration variable in the integrated variable definition table 35 E refers to a configuration of the variables X included in the integrated variable Z identified with a corresponding integrated variable name. As described above, the integrated variable Z1 is the integrated variable Z including the variable X1 and the variable X2. Thus, in the integrated variable definition table 35 E, “X1, X2” are set in advance as configuration variables corresponding to the integrated variable name “Z1”.
C is a schematic diagram illustrating an example of a data configuration of the error model definition table 35 D. The error model definition table 35 D is a table specifying a format of the constraint expression for each of the sensors S included in the space MS as the observation target similarly to the error model definition table 32 D according to the embodiment described above.
Specifically, the error model definition table 35 D is a table in which the sensor ID, the observation value variable, the error model, the upper bound, and the lower bound are associated with each other. The sensor ID, the observation value variable, the lower bound, and the upper bound are the same as those in the error model definition table 32 D in the embodiment described above.
The error model in the error model definition table 35 D is a model representing the format of the constraint expression. Similarly to the embodiment described above, the error model is a model including the observation value variable of the observation value, and specifying a relation between the variable X and the error term related to the assumed detection error range of the sensor S for each of the sensor S. However, in the present embodiment, the error model in the error model definition table 35 D is an error model using the integrated variable Z obtained by integrating at least part of the variables X of the observation unit spaces included in the observation space of the sensor S.
Specifically, for example, as described above, the present modification assumes a case in which the variable X1 and the variable X2 of the respective observation unit spaces present in the observation space of the sensor S11 are integrated to be treated as the integrated variable Z1. Thus, a portion representing addition of the variable X1 and the variable X2 in the error model definition table 35 D is represented by the integrated variable Z1.
In this case, the derivation unit 20 B may derive the constraint expression by substituting the observation value acquired by the acquisition unit 20 A for the term of the observation value variable included in the error model using the error model set in the error model definition table 35 D. That is, the derivation unit 20 B may derive the constraint expression similarly to the embodiment described above except that the error model set in the error model definition table 35 D is used in place of the error model set in the error model definition table 32 D.
Through this constraint expression derivation processing, the derivation unit 20 B describes the constraint expression using, as the variable, the integrated variable Z obtained by integrating at least part of the variables X of the observation unit spaces included in the observation range of the sensor S.
Each of the range calculation unit 20 C in the first embodiment and the range calculation unit 21 C in the second embodiment calculates the range of the number of present people for each observation range of the sensor S using the constraint expression derived by the derivation unit 20 B. Each of the range calculation unit 20 C and the range calculation unit 21 C then calculates the possible range of the number of present people in the area EA by distributing the calculated range of the number of present people to each of the observation unit spaces using area ratios of the observation unit spaces included in the observation range of the sensor S.
Specifically, the range calculation unit 20 C calculates the possible range of the number of present people in the area EA through the following processing.
is a flowchart illustrating an example of the procedure of the range calculation processing performed by the range calculation unit 20 C.
The range calculation unit 20 C reads the range definition DB 34 from the storage unit 30 (Step S 1000 ).
Next, the range calculation unit 20 C performs the processing at Step S 1002 to Step S 1010 for each of the areas EA included in the space MS as the observation target.
Specifically, the range calculation unit 20 C calculates a solution of the maximization problem of the number of present people in the area EA as a processing target using the constraint expression derived by the derivation unit 20 B (Step S 1002 ). The range calculation unit 20 C also calculates a solution of the minimization problem of the number of present people in the area EA as a processing target using the constraint expression derived by the derivation unit 20 B (Step S 1004 ). Pieces of the processing at Step S 1002 and Step S 1004 are the same as those at Step S 302 and Step S 304 in the first embodiment described above (refer to ).
Next, the range calculation unit 20 C converts the minimum value of the number of present people of the integrated variable Z as the solution calculated at Step S 1004 into the number of present people of the variable X before integration (Step S 1006 ).
The range calculation unit 20 C also converts the maximum value of the number of present people of the integrated variable Z as the solution calculated at Step S 1002 into the number of present people of the variable X before integration (Step S 1008 ).
At Step S 1006 and Step S 1008 , the range calculation unit 20 C specifies the variables X before integration of the integrated variable Z by reading configuration variables corresponding to the integrated variable name of the integrated variable Z from the integrated variable definition table 35 E. For example, assumed is a case in which the integrated variable definition table 35 E illustrated in B is stored in the storage unit 30 . In this case, the range calculation unit 20 C specifies the variable X1 and the variable X2 as the variables X before integration of the integrated variable Z1.
The range calculation unit 20 C then converts the integrated variable Z into the number of present people represented by the variable X before integration using the following expression (F). The number of present people represented by the variable X before integration=ratio of the variable X before integration/Σ(ratio of the variable X )×solution of the integrated variable Z (F)
In the expression (F), the ratio represents a ratio corresponding to the variable name of the variable X as a processing target set in the variable definition table 35 A.
The range calculation unit 20 C then calculates the maximum endpoint and the minimum endpoint of the possible range of the number of present people in accordance with the minimum value after conversion at Step S 1006 , the maximum value after conversion at Step S 1008 , and the endpoint definition specified in the range definition DB 34 (Step S 1010 ). The processing at Step S 1010 is the same as that at the Step S 306 and the Step S 308 described in the first embodiment (refer to ).
After performing the processing at Step S 1002 to Step S 1010 for each of the areas EA included in the space MS as the observation target, the range calculation unit 20 C advances the process to Step S 1012 . At Step S 1012 , the range calculation unit 20 C outputs, to the reliability calculation unit 20 D, the possible range of the number of present people in each of all the areas EA included in the space MS as the observation target derived by repeatedly performing the processing at Step S 1002 to Step S 1010 (Step S 1012 ). This routine is then ended.
Next, the following describes a procedure of range calculation processing performed by the range calculation unit 21 C according to the second embodiment using the constraint expression according to the present modification.
is a flowchart illustrating an example of the procedure of the range calculation processing performed by the range calculation unit 21 C.
The range calculation unit 21 C reads the range definition DB 34 from the storage unit 30 (Step S 1100 ). The range calculation unit 21 C also reads the priority definition DB 36 from the storage unit 30 (Step S 1102 ).
Next, for each of the areas EA included in the space MS as the observation target, the range calculation unit 21 C performs the processing at Step S 1104 to Step S 1112 for each of the K combinations specified in the priority definition DB 36 read at Step S 1102 .
Specifically, the range calculation unit 21 C sets the objective function represented by the expression (C) described above for each of the K combinations of the weight values specified in the weight definition table 36 B of the priority definition DB 36 read at Step S 1102 (Step S 1104 ).
The range calculation unit 21 C then solves a mathematical optimization problem of the objective function set at Step S 1104 (Step S 1106 ). Pieces of the processing at Step S 1100 to Step S 1106 are the same as those at Step S 500 to Step S 506 in the second embodiment described above (refer to ).
Next, the range calculation unit 21 C converts the minimum value of the number of present people of the integrated variable Z as the solution calculated at Step S 1106 into the number of present people of the variable X before integration (Step S 1108 ). The range calculation unit 21 C also converts the maximum value of the number of present people of the integrated variable Z as the solution calculated at Step S 1106 into the number of present people of the variable X before integration (Step S 1110 ).
The range calculation unit 21 C may perform the processing at Step S 1108 and Step S 1110 similarly to Step S 1006 and Step S 1008 described above (refer to ).
The range calculation unit 21 C then derives the estimation value of the number of present people for each of the areas EA using solutions of the variables X converted at Step S 1108 and Step S 1110 (Step S 1112 ).
By repeatedly performing the processing at Step S 1104 to S 1112 , the range calculation unit 21 C calculates, for each of the areas EA included in the space MS as the observation target, the estimation value of the number of present people for each of the K combinations specified in the priority definition DB 36 .
Next, in accordance with the definition specified in the range definition DB 34 read at Step S 1110 , the range calculation unit 21 C calculates the maximum endpoint and the minimum endpoint of the number of present people using the estimation value of the number of present people calculated by the processing at Step S 1104 to Step S 1112 (Step S 1114 ). That is, the range calculation unit 21 C calculates, for each of the areas EA, the possible range of the number of present people specified by the maximum endpoint and the minimum endpoint.
The range calculation unit 21 C then outputs, to the reliability calculation unit 21 D, the possible range of the number of present people specified by the maximum endpoint and the minimum endpoint (Step S 1116 ). This routine is then ended.
As described above, the present modification uses the integrated variable Z obtained by integrating at least part of the variables X of the observation unit spaces included in the observation space of the sensor S.
Therefore, in the present modification, the reliability of the estimation value of the number of present people in the area EA can be calculated with a low load and at high speed in addition to the effect of the embodiments described above. According to the present modification, it is possible to prevent the solutions of the variables having linear dependence from being different from each other due to a difference in the solution method used for mathematical optimization.
Next, the following describes an example of hardware configurations of the information processing device 10 , the information processing device 10 B, and the information processing device 10 C according to the embodiments described above.
is a hardware configuration diagram as an example of the information processing device 10 , the information processing device 10 B, and the information processing device 10 C according to the embodiments described above.
Each of the information processing device 10 , the information processing device 10 B, and the information processing device 10 C according to the embodiments described above has a hardware configuration including a control device such as a central processing unit (CPU) 90 B, storage devices such as a read only memory (ROM) 90 C, a random access memory (RAM) 90 D, and a hard disk drive (HDD) 90 E, an I/F unit 90 A as an interface with various appliances, and a bus 90 F that connects respective parts with each other, and utilizing a typical computer.
In each of the information processing device 10 , the information processing device 10 B, and the information processing device 10 C according to the embodiments described above, the respective parts are implemented on the computer when the CPU 90 B reads out a computer program from the ROM 90 C onto the RAM 90 D, and executes the computer program.
The computer program for performing the pieces of processing described above executed by the information processing device 10 , the information processing device 10 B, and the information processing device 10 C according to the embodiments described above may be stored in the HDD 90 E. The computer program for performing the pieces of processing described above executed by the information processing device 10 , the information processing device 10 B, and the information processing device 10 C according to the embodiments described above may be embedded and provided in the ROM 90 C.
The computer program for performing the pieces of processing described above executed by the information processing device 10 , the information processing device 10 B, and the information processing device 10 C according to the embodiments described above may be stored in a computer-readable storage medium such as a CD-ROM, a CD-R, a memory card, a Digital Versatile Disc (DVD), and a flexible disk (FD), as an installable or executable file, and provided as a computer program product. The computer program for performing the pieces of processing described above executed by the information processing device 10 , the information processing device 10 B, and the information processing device 10 C according to the embodiments described above may be stored in a computer connected to a network such as the Internet and provided by being downloaded via the network. Furthermore, the computer program for performing the pieces of processing described above executed by the information processing device 10 , the information processing device 10 B, and the information processing device 10 C according to the embodiments described above may be provided or distributed via a network such as the Internet.
While certain embodiments have been described, these embodiments have been presented by way of example only, and are not intended to limit the scope of the inventions. Indeed, the novel embodiments described herein may be embodied in a variety of other forms; furthermore, various omissions, substitutions and changes in the form of the embodiments described herein may be made without departing from the spirit of the inventions. The accompanying claims and their equivalents are intended to cover such forms or modifications as would fall within the scope and spirit of the inventions.
Figures (20)
Citations
This patent cites (22)
- US6073089
- US11928591
- US2012/0331024
- US2014/0236871
- US2016/0369777
- US2018/0082204
- US2018/0316517
- US2019/0332638
- US2021/0303381
- US2022/0318340
- US2023/0161929
- US2023/0288527
- US2024/0048127
- US2024/0219873
- US4011569
- US4908541
- US5002733
- US2019-12494
- US6562883
- US2021-9728
- USWO-2007033939
- USWO-2022091578