Method and Apparatus for Analyzing Gaseous Samples
Abstract
A measuring apparatus for measuring a spectrum of a gaseous sample includes a tunable laser light source to provide an illuminating light beam, a sample cell with an inner surface to provide scrambled light that is transmitted through the gaseous sample, a detector to detect intensity of transmitted scrambled light and a pressure control system to maintain an absolute pressure of the gaseous sample smaller than 50 kPa inside the sample cell to reduce spectral widths of spectral features of the gaseous sample. The measuring apparatus measures spectral transmittance values of the sample by modulating the spectral position of the illuminating light, and detecting the intensity of the transmitted light at different spectral positions. The divergence of the illuminating light beam in a transverse direction is greater than 30° to cause multiple consecutive reflections of the scrambled light from the inner surface.
Claims (9)
1. A measuring apparatus for measuring a spectrum of a gaseous sample, the apparatus comprising: a tunable laser light source to provide an illuminating light beam, a sample cell for containing the gaseous sample, the cell comprising an inner surface to provide transmitted light by reflecting light of the illuminating light beam such that the transmitted light is transmitted through the gaseous sample, and a detector to detect intensity of the transmitted light guided through the sample cell, wherein the measuring apparatus is arranged to measure one or more spectral transmittance value of the sample by modulating the spectral position of the illuminating light, and by detecting the intensity of the transmitted light at two or more different spectral positions of the illuminating light, wherein the apparatus further comprises a pressure control system to maintain an absolute pressure of the gaseous sample smaller than 50 kPa inside the sample cell so as to reduce spectral widths of spectral features of the gaseous sample, wherein the total reflectance of the inner surface is greater than 80% at the wavelength of the illuminating light beam, wherein the specular reflectance of the inner surface is smaller than 50% such that the transmitted light has scrambled phase, wherein a longitudinal dimension of the inner surface is in the range of 10 to 100 times a minimum diameter of the inner surface, and wherein the divergence of the illuminating light beam in a transverse direction is greater than 30° so as to cause multiple consecutive reflections of the scrambled light from the inner surface.
9. A method for measuring a spectrum of a gaseous sample, comprising: providing an illuminating laser light beam, providing a sample cell for containing the gaseous sample, the cell comprising an inner surface, varying the spectral position of the illuminating light, detecting intensity of transmitted light, providing transmitted light by using the inner surface to reflect light of the illuminating light beam such that the transmitted light is transmitted through the gaseous sample, and detecting intensity of transmitted light guided through the sample cell at two or more spectral positions of the illuminating light, wherein the method comprises: maintaining an absolute pressure of the gaseous sample smaller than 50 kPa inside the sample cell so as to reduce spectral widths of spectral features of the gaseous sample, wherein the total reflectance of the inner surface is greater than 80% at the wavelength of the illuminating light beam, where the specular reflectance of the inner surface is smaller than 50% such that the transmitted light has scramble phase, wherein the longitudinal dimension of the inner surface is in the range of 10 to 100 times a minimum diameter of the inner surface, and wherein the divergence of the illuminating light beam in a transverse direction is greater than 30° so as to cause multiple consecutive reflections of the scrambled light from the inner surface.
Show 7 dependent claims
2. The apparatus of claim 1 , wherein the illuminating light beam is coupled from a laser emitter into the sample cell without using focusing and/or collimating optics between the laser emitter and the sample cell.
3. The apparatus of claim 1 , wherein the illuminating light beam is coupled from a laser emitter into the sample cell such that the refractive power of optics between the laser emitter and the sample cell is smaller than 50 dioptre.
4. The apparatus according to claim 1 , wherein the light source is an interband cascade laser or a quantum cascade laser.
5. The apparatus according to claim 1 , wherein the apparatus is arranged to modulate the wavelength of the illuminating beam, and to measure a ratio of the concentration of carbon isotope 13 C bound in carbon dioxide to the concentration of carbon isotope 12 C bound in carbon dioxide by detecting spectral transmittance of carbon dioxide at three or more spectral positions.
6. The apparatus according to claim 1 , wherein the arithmetic mean roughness Ra of the inner surface of the sample cell is in the range of 0.25 to 2 times the maximum wavelength of the spectral modulation range of the illuminating light beam.
7. The apparatus according to claim 1 , wherein the wavelength of the illuminating light beam is in the range of 4.3 μm to 4.4 μm.
8. The apparatus according to claim 1 , wherein the arithmetic mean roughness Ra of the inner surface of the sample cell is in the range of 0.5 μm to 8 μm.
Full Description
Show full text →
FIELD
Some embodiments relate to analyzing composition of a gaseous sample.
BACKGROUND
The composition of a gaseous sample may be analyzed by using direct absorption spectroscopy. For example, a respiratory air sample obtained from a subject may be analyzed by using direct absorption spectroscopy.
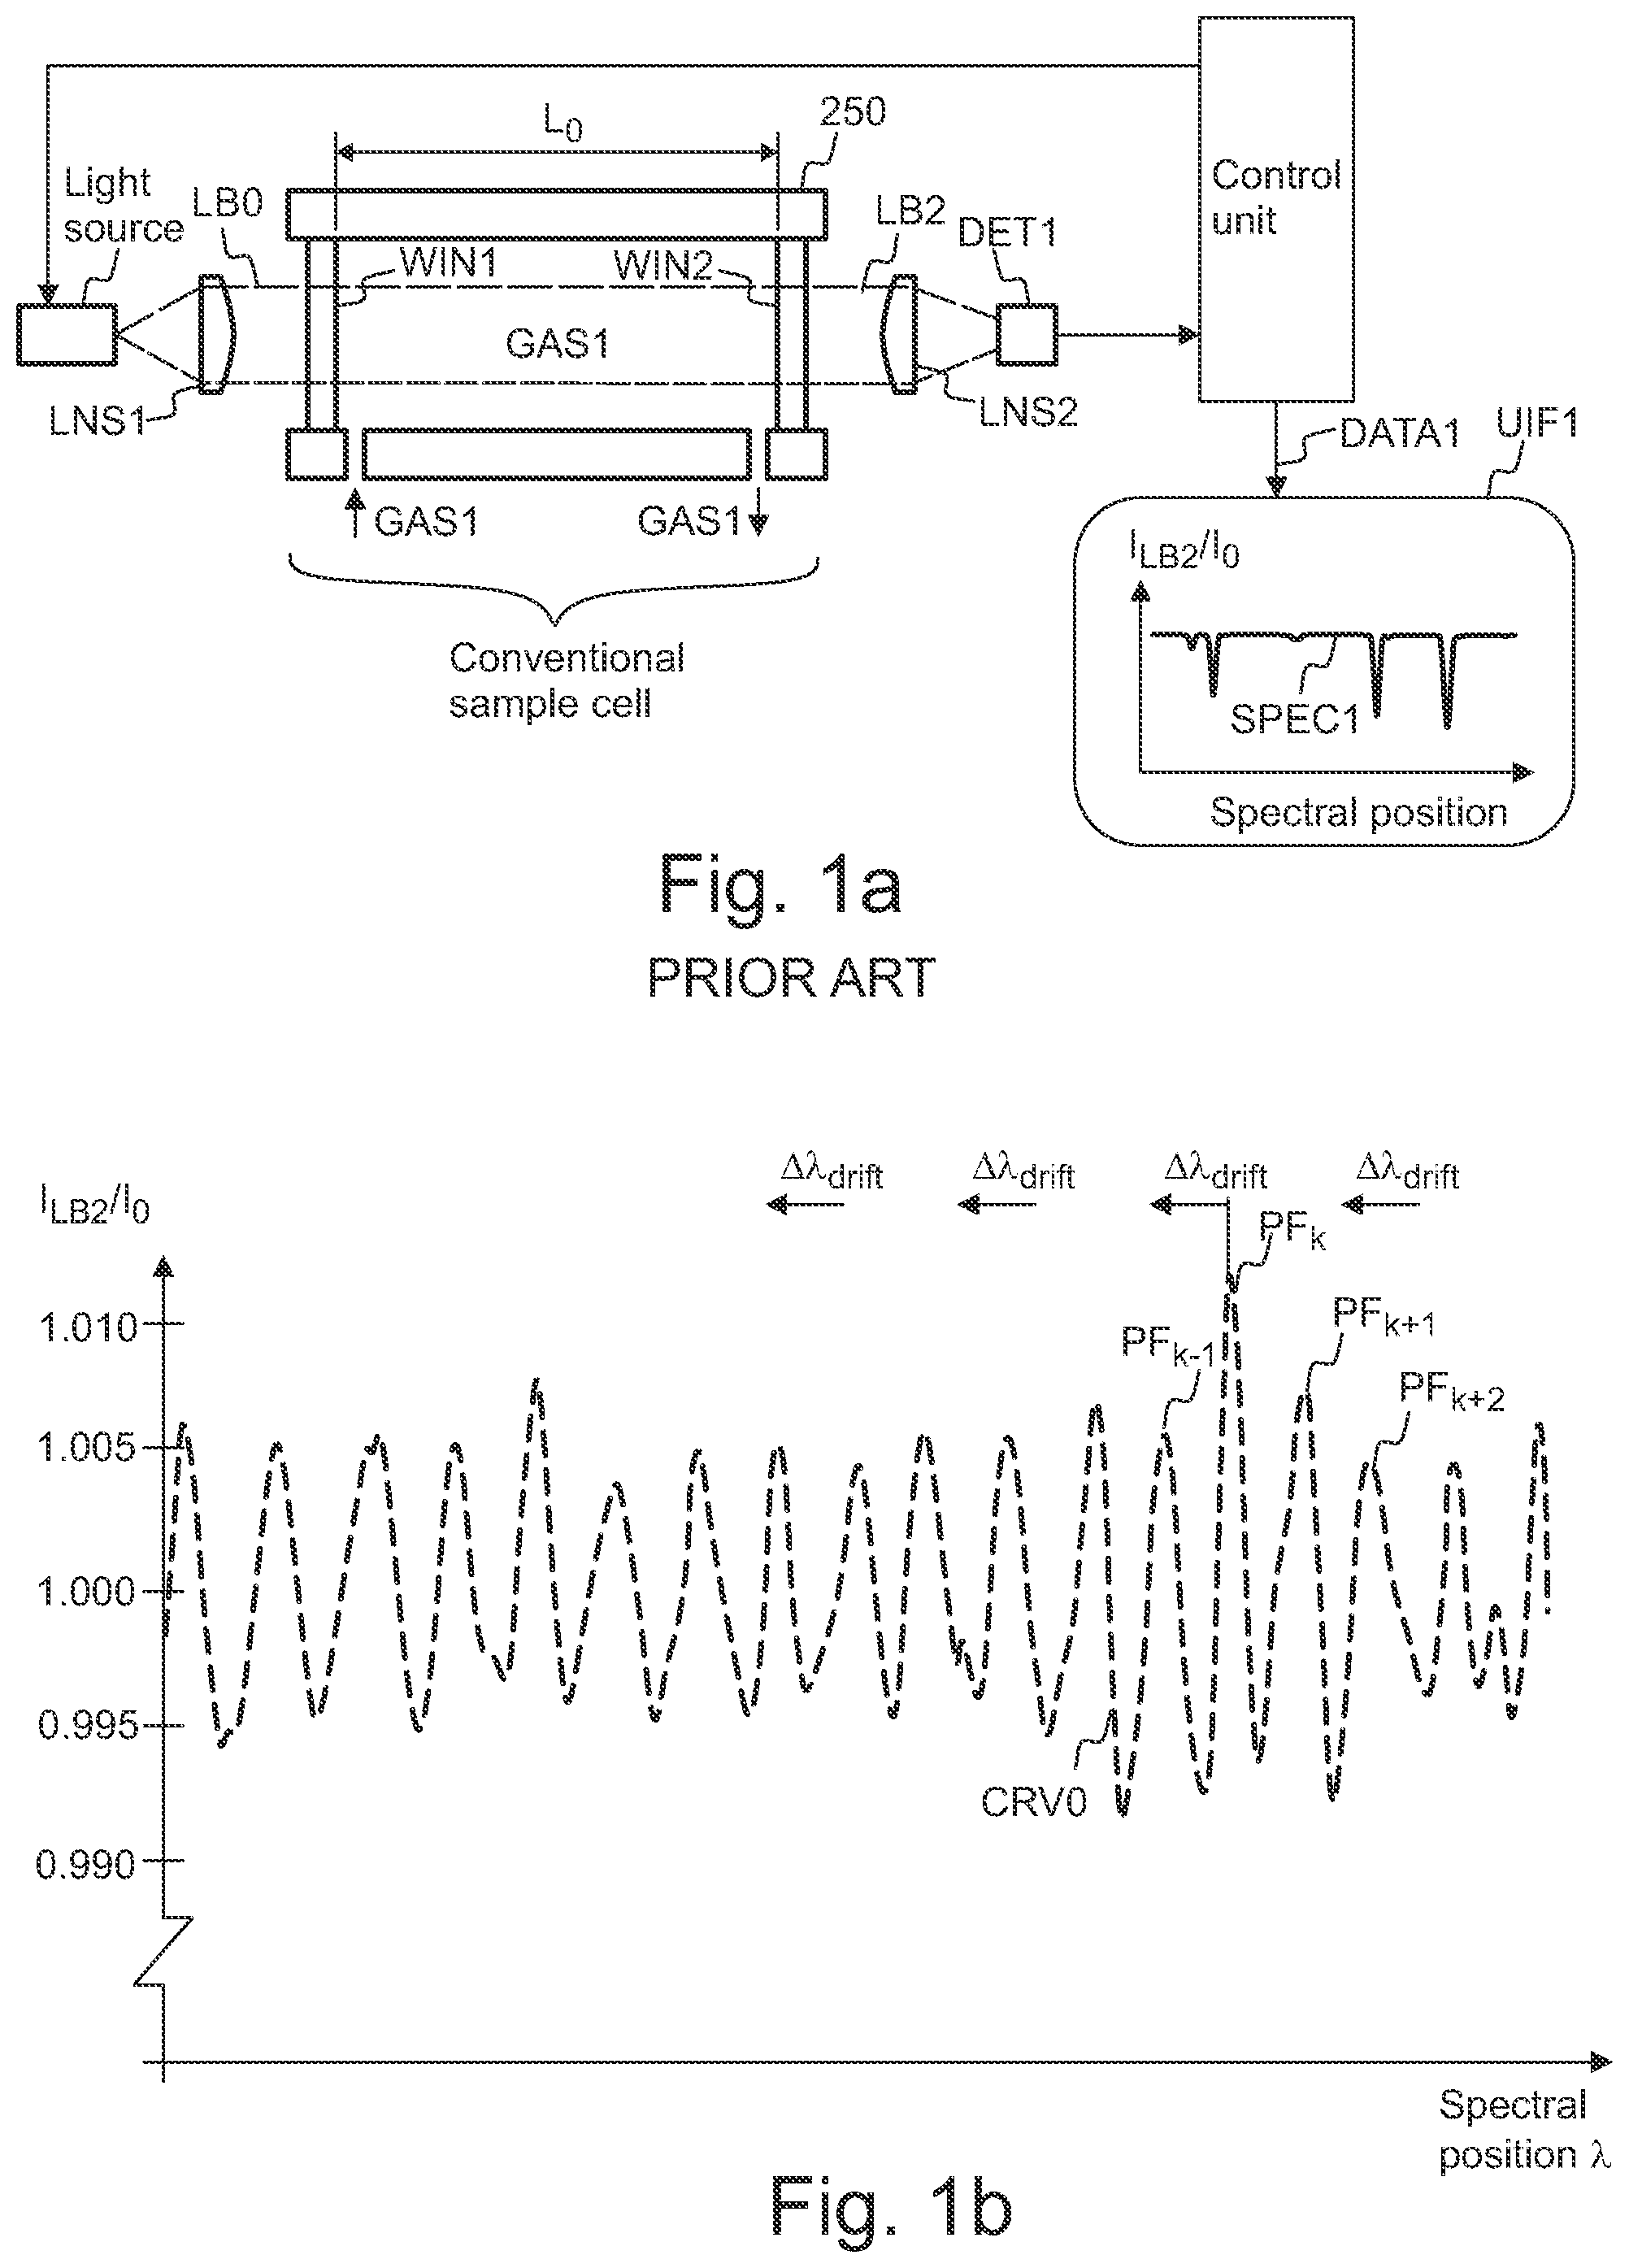
shows a known measurement system for performing direct absorption spectroscopy. The known measurement system may comprise a sample cell for containing sample gas GAS 1 , a light source LS 1 to provide illuminating light LB 0 , and a detector DET 1 to detect light LB 2 transmitted through the cell. The system may comprise collimating optics LNS 1 to collimate the illuminating light LB 0 , and light gathering optics LNS 2 to collect transmitted light LB 2 to the detector DET 1 . The light source LS 1 may tunable, i.e. the wavelength of the illuminating light LB 0 may be adjustable. The illuminating light LB 0 may have narrow bandwidth. The measurement system may measure a spectral transmittance function I LB2 (λ)/I 0 (λ) of a sample GAS 1 by varying the wavelength λ LB0 of the illuminating light LB 0 , and by measuring the intensity I LB2 of the transmitted light LB 2 as a function of the wavelength. An absorption spectrum SPEC 1 of the sample GAS 1 may be determined from the measured spectral transmittance I LB2 (λ)/I 0 (λ). The sample contained in the cell may attenuate the transmitted light at certain wavelengths, corresponding to the absorption peaks of the sample. Performing direct absorption spectroscopy may comprise measuring the spectral intensity of transmitted light at one or more spectral positions (wavelengths), and determining one or more properties of the sample by comparing the measured spectral intensity values with a reference value. Performing direct absorption spectroscopy may comprise measuring the spectral intensity of transmitted light at one or more spectral positions (wavelengths), and determining one or more properties of the sample by comparing the measured spectral intensity values with a reference spectrum. A reference spectrum of a reference gas may be obtained e.g. by filling the sample cell 200 with the reference gas, and by using the measuring device for measuring the spectral transmittance of the reference gas. For example, at a predetermined wavelength, the ratio (I LB2 /L 0 ) of the spectral intensity I LB2 of transmitted light LB 2 to a reference value I 0 may depend on the concentration of a gaseous component of the sample. Consequently, the concentration of the gaseous component may be determined by measuring the spectral intensity I LB2 of the transmitted light at one or more spectral positions, and by calculating the concentration of the gaseous component from the measured spectral intensity I LB2 and from a reference value I 0 . The reference value I 0 may be e.g. a maximum value of the spectral intensity of transmitted light LB 2 .
The sample cell typically comprises optical windows WIN 1 , WIN 2 to confine the sample gas to the internal space of the cell, and to define the length of an absorption path. A part of the transmitted light may be reflected back and forth between the surfaces of the windows WIN 1 , WIN 2 . The windows of the sample cell may together operate as an interferometer, which may cause disturbing interference effects. In principle, any pair of optical surfaces may operate as an optical interferometer or as a weak optical interferometer.
b shows, by way of example, a measured spectral intensity I LB2 of light LB 2 , which has been transmitted through the conventional sample cell, in a situation where the cell is empty, and the illuminating beam is a collimated coherent laser beam. The measured intensity I LB2 of a has been normalized by dividing with a reference value I 0 .
A large part of the fluctuations of the measured signal I LB2 may be caused by the interferometric fringes. A pair of optical interfaces of a conventional cell may cause disturbing interference effects. In particular, the interferometric effects of the windows of the conventional cell may make it difficult or impossible to detect weak absorption of a sample gas. Furthermore, detected spectral transmittance and results derived from the detected spectral transmittance may be prone to drift due to changes in interferometric response.
Interferometric effects of the cell may cause a plurality of spectral features to the spectral transmittance I LB2 (λ)/I 0 of the cell. The curve CRV 0 shows, by way of example, the spectral transmittance I LB2 (λ)/I 0 (λ) of a conventional cell. The interferometric effects of the cell may cause a plurality of spectral features to the spectral transmittance I LB2 (λ)/I 0 of the cell also in a situation where the gas inside the cell does not absorb light. For example, the interferometric effects of the cell may cause a plurality of spectral interference peaks . . . , PF k−1 , PF k , PF k+1 , PF k+2 , . . . to the spectral transmittance I LB2 (λ)/I 0 of the cell. The spectral positions of the spectral features PF k−1 , PF k , PF k+1 , PF k+2 , . . . may drift e.g. due a change of operating temperature of the cell. The symbol Δλ drift may denote a spectral drift of the spectral features of the spectral transmittance I LB2 (λ)/I 0 of the cell.
When using the conventional sample cell, optical interference features PF k−1 , PF k , PF k+1 , PF k+2 typically exist due to a coherent nature of the laser radiation. In case of the conventional cell with coherent illumination, the periodic fluctuations of the detected spectral intensity I LB2 may be too stable to be averaged out, whereas the periodic fluctuations of the detected spectral intensity I LB2 are typically not stable enough to prevent the measurement results from drifting during a longer time period, e.g. during a time period of few minutes.
SUMMARY
Some variations may relate to a method for analyzing composition of a gaseous sample. Some variations may relate to an apparatus for analyzing composition of a gaseous sample. Some variations may relate to an apparatus for analyzing composition of a gaseous sample obtained from a processing system. Some variations may relate to a method for monitoring operation of a processing system. Some variations may relate to a method for analyzing composition of a respiratory air sample. Some variations may relate to an apparatus for analyzing composition of a respiratory air sample.
According to an aspect, there is provided a measuring apparatus ( 500 ) for measuring a spectrum (SPEC 1 ) of a gaseous sample (GAS 1 ), the apparatus ( 500 ) comprising:
•
• a tunable laser light source (LS 1 ) to provide an illuminating light beam (LB 0 ), • a sample cell ( 200 ) for containing the gaseous sample (GAS 1 ), the cell ( 200 ) comprising an inner surface (SRF 1 ) to provide scrambled light (LB 1 ) by reflecting light of the illuminating light beam (LB 0 ) such that the scrambled light is transmitted through the gaseous sample (GAS 1 ), • a detector (DET 1 ) to detect intensity (I LB2 ) of transmitted scrambled light (LB 2 ) guided through the sample cell ( 200 ), and • a pressure control system (VAC 1 ) to maintain an absolute pressure (p GAS1 ) of the gaseous sample (GAS 1 ) smaller than 50 kPa inside the sample cell ( 200 ) so as to reduce spectral widths of spectral features of the gaseous sample (GAS 1 ), wherein the measuring apparatus ( 500 ) is arranged to measure one or more spectral transmittance values (I LB2 (λ)/I 0 (λ)) of the sample (GAS 1 ) by modulating the spectral position (λ LB0 ) of the illuminating light (LB 0 ), and by detecting the intensity (I LB2 ) of the transmitted light (LB 2 ) at two or more different spectral positions (λ 0 , λ P1 ) of the illuminating light (LB 0 ), wherein the longitudinal dimension (L SRF1 ) of the inner surface (SRF 1 ) is in the range of 10 to 100 times a minimum diameter (d SRF1 ) of the inner surface (SRF 1 ), and wherein the divergence (θ LB0 ) of the illuminating light beam (LB 0 ) in a transverse direction is greater than 30° so as to cause multiple consecutive reflections of the scrambled light (LB 1 ) from the inner surface (SRF 1 ).
According to an aspect, there is provided a method for measuring a spectrum (SPEC 1 ) of a gaseous sample (GAS 1 ), comprising:
•
• providing an illuminating laser light beam (LB 0 ), • providing a sample cell ( 200 ) for containing the gaseous sample (GAS 1 ), the cell ( 200 ) comprising an inner surface (SRF 1 ), • providing scrambled light (LB 1 ) by using the inner surface (SRF 1 ) to reflect light of the illuminating light beam (LB 0 ) such that the scrambled light (LB 1 ) is transmitted through the gaseous sample (GAS 1 ), • varying the spectral position (λ LB0 ) of the illuminating light (LB 0 ), • detecting intensity (I LB2 ) of transmitted scrambled light (LB 2 ) guided through the sample cell ( 200 ) at two or more spectral positions (λ 0 , λ P1 ) of the illuminating light (LB 0 ), and • maintaining an absolute pressure (p GAS1 ) of the gaseous sample (GAS 1 ) smaller than 50 kPa inside the sample cell ( 200 ) so as to reduce spectral widths of spectral features of the gaseous sample (GAS 1 ),
wherein the longitudinal dimension (L SRF1 ) of the inner surface (SRF 1 ) is in the range of 10 to 100 times a minimum diameter (d SRF1 ) of the inner surface (SRF 1 ), and wherein the divergence (θ LB0 ) of the illuminating light beam (LB 0 ) in a transverse direction is greater than 30°, so as to cause multiple consecutive reflections of the scrambled light (LB 1 ) from the inner surface (SRF 1 ).
Further aspects are defined in the claims.
When using the sample cell, the phase of the laser radiation is effectively scrambled inside the tightly confined, diffusive measurement tunnel, to significantly reduce or eliminate the disturbing effect of the optical interference features.
The internal pressure of the sample cell may be kept at a reduced value in order to facilitate measurement of the spectrum. The use of the reduced gas pressure may cause drifting of the interference features. The scrambling sample cell may significantly reduce or eliminate the disturbing effect of said drifting.
When using the phase-scrambling sample cell, it is not necessary to precisely align the scrambling sample cell with the optical axis of the illuminating laser beam.
Dust deposited on a window may increase reflection coefficient of the window. In case of a conventional cell, the increased reflection coefficient of the window may have a significant effect on the interference features caused by the windows of the cell. To a certain degree, the scrambling sample cell may be tolerant to dust, which may be deposited on the windows. The scrambling sample cell may reduce or eliminate interference effects caused by dust deposited on a window of the cell.
A diverging laser beam may be directly transmitted into the scrambling tunnel of the cell. The tunnel may have a diffusive uneven inner surface. Multiple reflections of the laser light inside the tunnel may scramble the phase of the coherent light, effectively suppressing the optical interference.
When using the scrambling sample cell, it is not necessary to use long averaging or integrating time periods to reduce signal noise caused by the interference effects Consequently, the spectral data may be measured at an increased rate, when compared with a situation where spectral data is measured by using a conventional cell. The phase-scrambling cell may substantially reduce or eliminate amplitudes of interference features. The phase-scrambling cell may substantially reduce or eliminate amplitudes of interference fringes. The reduced fringe amplitudes in the phase-scrambling cell may allow increasing the length of a time period between consecutive calibrations. The phase-scrambling cell may even completely remove a need for periodic calibration. The scrambling sample cell may be used as a single-pass absorption cell. The scrambling sample cell may be used e.g. for measuring carbon monoxide CO and/or carbon dioxide by direct absorption spectroscopy.
A measuring apparatus may comprise the scrambling cell in order to suppress the interferometric fringe effect. The measuring apparatus may be arranged to analyze composition of a gaseous sample by direct absorption spectroscopy. The measuring apparatus may be arranged to analyze e.g. the composition of a respiratory air sample obtained from a subject.
In an embodiment, the measuring apparatus may be arranged to analyze the composition of the sample obtained from an industrial processing system. The processing system may comprise e.g. an apparatus for producing combustible gas by fermentation of biological material. The operation of the processing system may be controlled, analyzed and/or optimized based on the analysis.
In an embodiment, the measuring apparatus may be arranged to analyze the composition of the sample e.g. in order to determine one or more physical and/or metabolic parameters of the body of the subject. The measured information may be used e.g. to monitor a state of the body of the subject. The measured information may comprise e.g. information about the concentration of an anesthetic agent in the respiratory air sample. The measured information may be used e.g. for controlling an anesthetic system.
BRIEF DESCRIPTION OF THE DRAWINGS
In the following examples, several variations will be described in more detail with reference to the appended drawings, in which
a shows, by way of example, a measuring apparatus, which comprises a sample cell according to prior art,
b shows, by way of example, measured spectral intensity of laser light transmitted through the sample cell of a,
shows, by way of example, in a cross-sectional side view, a measuring apparatus, which comprises a scrambling sample cell,
shows, by way of example, in a cross-sectional side view, propagation of light in the scrambling sample cell,
shows, by way of example, measured spectral intensity of laser light transmitted through the scrambling sample cell, and measured spectral intensity of laser light transmitted through the conventional sample cell of a,
shows, by way of example, spectral intensity of the transmitted light as a function of spectral position, in a situation where the scrambling sample cell contains an absorbing sample,
a shows, by way of example, a measuring apparatus arranged to measure the concentration of one or more molecular substances of a gaseous sample obtained from a processing system,
b shows, by way of example, a measuring apparatus arranged to measure the concentration of one or more molecular substances of a gaseous sample,
c shows, by way of example, a measuring apparatus arranged to measure the concentration of one or more molecular substances of a gaseous sample,
shows, by way of example, an absorption spectrum of a sample gas,
a shows, by way of example, a pressure control system for reducing and controlling internal pressure of the sample cell,
b shows, by way of example, a temperature control system for stabilizing temperature of the sample cell,
a shows, by way of example, in a cross-sectional side view, a nonlinear sample cell,
b shows, in an end view, the sample cell of a , and
shows, by way of example, measuring temporal evolution of a concentration of an absorbing substance.
DETAILED DESCRIPTION
Referring to , the measuring apparatus 500 may comprise a sample cell 200 for containing a sample gas GAS 1 , a light source LS 1 to provide illuminating light LB 0 , and a detector DET 1 to detect intensity of transmitted light LB 2 , which has been transmitted through the sample cell 200 . The illuminating light LB 0 is coupled into the sample cell 200 . The illuminating light LB 0 may also be called e.g. as input light LB 0 .
The sample cell 200 may comprise a housing 250 , a first window WIN 1 and a second window WIN 2 to confine the sample gas GAS 1 to the internal space of the cell 200 . Illuminating light LB 0 may be coupled into the cell 200 through the first window WIN 1 . The transmitted light LB 2 may be coupled out of the cell 200 through the second window WIN 2 . The cell 200 may comprise a first window WIN 1 for coupling light into the cell 200 , and a second window WIN 2 for coupling light out of the cell 200 . The distance between the windows WIN 1 , WIN 2 may define an inner longitudinal dimension L 0 of the cell 200 .
The cell 200 may comprise an input 201 for guiding sample gas GAS 1 into the cell 200 and an output 202 for guiding sample gas GAS 1 out of the cell 200 . The cell 200 may comprise one or more openings 201 , 202 for changing the contents of the cell 200 . A first sample may be replaced with a second sample by using the one or more openings 201 , 202 . The sample gas GAS 1 may be moved into the cell and out of the cell e.g. by using a sample pump. The sample gas GAS 1 inside the cell may also be substantially continuously changed during a measuring time period, so as to measure temporal changes of the composition and/or state of the sample GAS 1 .
The cell 200 may comprise a scrambling tunnel CAV 1 to form scrambled light LB 1 by reflecting light of the illuminating beam LB 0 . The tunnel CAV 1 may comprise an uneven surface SRF 1 to form scrambled light LB 1 by reflecting light of the illuminating beam LB 0 . The internal space of the tunnel CAV 1 may be defined by the surface SRF 1 . The tunnel CAV 1 may consist of the surface SRF 1 and the internal space. The scrambled light LB 1 may be guided via the tunnel CAV 1 through the cell 200 . Transmitted scrambled light LB 2 may be coupled out of the cell 200 through the second window WIN 2 . Multiple reflections of the light from the uneven surface SRF 1 may effectively smooth out spectral interference effects of the windows WIN 1 , WIN 2 .
In case of the uneven surface SRF 1 , the effective length of optical absorption path of the cell 200 may be greater than the distance L 0 between the windows WIN 1 , WIN 2 . If needed, the effective length of optical absorption path of the cell 200 may be determined e.g. by an experimental test and/or by simulation. The effective length of optical absorption path of the cell 200 may be experimentally determined e.g. by filling the cell 200 with a reference gas, which has a known concentration of an absorbing gaseous component, by measuring the spectral transmittance at one or more relevant wavelengths, by calculating transmittance values from known data, and by determining the length of optical absorption path by fitting calculated transmittance values to the measured transmittance values.
In an embodiment the ratio of a concentration of a first gaseous component to the concentration of a second gaseous component may also be determined from measured spectral transmittance values without a need to know the actual effective length of the optical absorption path. It may be assumed that the effective length of the optical absorption path is substantially the same for both gaseous components.
The sample GAS 1 contained in the scrambling cell 200 may provide the transmitted beam LB 2 by absorbing light of the scrambled light beam LB 1 according to the absorption spectrum of said sample GAS 1 . In particular, the sample GAS 1 may attenuate the spectral intensity at wavelengths corresponding to spectral peaks of the absorption spectrum of the sample GAS 1 .
The apparatus 500 may comprise an optical assembly 300 , which comprises an illuminating unit 300 A and a detector unit 300 B. The illuminating unit 300 A may comprise the light source LS 1 . The detector unit 300 B may comprise the detector DET 1 .
The illuminating light LB 0 may have a narrow spectral bandwidth, so as to allow measuring spectral absorbance by using spectrally selective illumination. The bandwidth of the light LB 0 may be e.g. smaller than 0.02 nm. The light source LS 1 may be e.g. a laser light source. The illuminating light LB 0 may be e.g. coherent laser light. The wavelength λ LB0 of the illuminating light LB 0 may be changed in order to measure spectral transmittance values of the filled cell 200 at several spectral positions. The absorbance values may be subsequently determined from the transmittance values. The wavelength XLB 0 of the illuminating light LB 0 may be changed in order to measure spectral absorbance values of the filled cell 200 at several spectral positions. The wavelength of the light emitted by the light source LS 1 may be tunable. The light source (LS 1 ) may be a tunable laser such that the wavelength (λ LB0 ) of the illuminating light beam (LB 0 ) is adjustable. For example, the light source LS 1 may be a laser diode, wherein the wavelength of the light LB 0 may be changed e.g. by changing an electric current of the laser diode LS 1 . The light source LS 1 may be a laser diode, wherein the wavelength of the light LB 0 may be changed e.g. by changing an electric current of the laser diode LS 1 and/or by changing operating temperature of the laser diode LS 1 .
The light source LS 1 may be arranged to provide the illuminating light LB 0 as a diverging beam. The diverging beam of illuminating light LB 0 may effectively interact with the inner surface SRF 1 of the sample cell 200 , so as to ensure sufficient degree of phase scrambling. The light source LS 1 may be e.g. a laser light emitter. In an embodiment, it is not necessary to use collimating optics or focusing optics to reduce the divergence of illuminating light emitted from a laser light emitter. In an embodiment, the apparatus 500 does not need to comprise collimating optics or focusing optics between a laser light emitter and the sample cell 200 . In an embodiment, the apparatus 500 may be implemented without collimating and/or focusing optics located between a light emitter and the sample cell 200 .
The illuminating light beam LB 0 may be coupled from a laser emitter LS 1 into the scrambling tunnel CAV 1 without using collimating and/or focusing optics located between the laser emitter LS 1 and the tunnel CAV 1 .
The focal length of optics between the laser emitter LS 1 and the tunnel CAV 1 may be e.g. greater than 0.02 m, in order to maintain large divergence of the illuminating beam LB 0 . The refractive power of the optics is equal to inverse of the focal length. The illuminating light beam LB 0 may be coupled from a laser emitter LS 1 into the scrambling tunnel CAV 1 such that the refractive power of optics between the laser emitter LS 1 and the tunnel CAV 1 is e.g. smaller than 50 dioptre.
The light source LS 1 may comprise e.g. an interband cascade laser (ICL) or a quantum cascade laser (QCL).
The light source LS 1 may be a tunable laser light source such that wavelength λ LB0 of at least one spectral component of the illuminating light beam LB 0 is adjustable.
The apparatus 500 may comprise a control unit 400 to change the spectral position λ of the illuminating light LB 0 , and to record the measured intensity I LB2 of the transmitted light LB 2 as a function of the spectral position λ. The apparatus 500 may be configured to provide spectral data DATA 1 , SPEC 1 by associating measured spectral intensity values I LB2 with the corresponding spectral positions (λ).
The control unit 400 may provide a control signal SIG 0 for changing the wavelength of the illuminating light LB 0 . The control signal SIG 0 may be communicated to the light source LS 1 . The light source LS 1 may be arranged to modulate the wavelength of the illuminating light LB 0 . The apparatus 500 may be arranged to provide a signal SIG 0 indicative of the wavelength of the illuminating light LB 0 .
The detector DET 1 may be arranged to provide a signal SIG 1 indicative of the detected spectral intensity of the transmitted light LB 2 . The signal SIG 1 may be e.g. an electric signal or a digital optical signal. The detector DET 1 may comprise e.g. one or more photodiodes or one or more photomultiplier tubes to convert intensity of the light LB 2 into a signal value of the signal SIG 1 .
The detector may be arranged to detect light LB 2 e.g. in the middle infrared range.
The detector DET 1 may comprise e.g. Mercury-Cadmium-Telluride (MCT), indium arsenide antimonide (InAsSb), or germanium (Ge).
The apparatus 500 may be configured to provide spectral data DATA 1 by associating each measured intensity value of the transmitted light LB 2 with the corresponding spectral position of the illuminating light LB 0 . The apparatus 500 may be configured to provide measured spectral data DATA 1 , which comprises spectral intensity values of the gas sample. The apparatus 500 may comprise a memory MEM 2 for storing the measured spectral data DATA 1 . The apparatus 500 may comprise a memory MEM 1 for storing computer program code PROC 1 . The computer program code PROC 1 may be configured to, when executed by the control unit 400 , to modulate the wavelength of the illuminating light LB 0 and/or to form spectral data DATA 1 by associating measured intensity values with corresponding spectral positions.
The apparatus 500 may comprise computer program code PROC 1 stored in computer readable memory MEM 1 . The program code PROC 1 , when executed by the control unit 400 , may cause the apparatus 500 to measure the spectral data DATA 1 . The control unit 400 may comprise one or more data processors. The measured data DATA 1 may be stored e.g. in a memory MEM 2 . The apparatus 500 may comprise a user interface UIF 1 for receiving user input from a user and/or for providing the measured data DATA 1 to a user. The apparatus 500 may comprise a user interface UIF 1 to provide one or more measurement results to a user. The user interface UIF 1 may comprise e.g. a display for graphically and/or numerically displaying measured and/or determined values. The apparatus 500 may be arranged to display curves, which show temporal evolution of the measured values. The user interface UIF 1 may comprise e.g. a display and/or a keyboard. The user interface UIF 1 may comprise e.g. a touch screen. The user interface may display e.g. a measured spectrum SPEC 1 of the sample GAS 1 . The user input and/or the data DATA 1 may be transmitted e.g. via a cable, via a wireless communication network and/or via the Internet.
Referring to , the diverging illuminating beam LB 0 may be coupled from a laser light source LS 1 through the first window WIN 1 into the scrambling tunnel CAV 1 . The tunnel CAV 1 may be defined by the uneven reflective surface SRF 1 .
The longitudinal dimension L 0 of the scrambling sample cell may be e.g. smaller than 0.5 m. The longitudinal dimension L SRF1 of the inner surface SRF 1 of the cell 200 may be smaller than 0.5 m, respectively.
The cross-section of the tunnel CAV 1 may be e.g. substantially circular or substantially elliptical, when viewed in the direction of propagation of the input light beam LB 0 . The cross-section of the tunnel CAV 1 may be e.g. substantially circular or substantially elliptical, when viewed in the longitudinal direction of the tunnel CAV 1 .
The diameter d SRF1 of the tunnel may be e.g. in the range of 0.5 mm to 6 mm. The diameter d SRF1 of the tunnel may be e.g. substantially equal to 3 mm. The tunnel CAV 1 may effectively scramble the phase of the illuminating light LB 0 .
The dimensions of the tunnel CAV 1 may be selected to provide several consecutive reflections from the surface SRF 1 , so as to effectively scramble the phase of the light LB 1 and LB 2 . The scrambling tunnel may have a longitudinal dimension LSRF 1 . The ratio of the length L SRF1 to the diameter d SRF1 of the tunnel may be e.g. greater than or equal to 10. The ratio of the longitudinal dimension L SRF1 to the diameter d SRF1 of the tunnel may be e.g. in the range of 10 to 100, e.g. in order to provide sufficient degree of scrambling in a compact volume.
The roughness of the inner surface SRF 1 of the tunnel CAV 1 may be selected e.g. such that the specular reflectance of the inner surface SRF 1 is smaller than 50%, advantageously smaller than 10%.
The roughness of the inner surface SRF 1 of the tunnel CAV 1 may be selected e.g. such that the specular reflectance of the inner surface SRF 1 is smaller than 50%, advantageously smaller than 10% at the wavelength λ LB0 of the illuminating light LB 0 .
The symbol Δh may denote an average height of protrusions of the surface SRF 1 .
The arithmetic mean roughness Ra of the inner surface SRF 1 may be e.g. in the range of 0.25 to 2 times the wavelength λ LB0 of the illuminating light LB 0 .
The wavelength λ LB0 of the light source LS 1 may be e.g. in the range of 4.3 μm to 4.4 μm.
The arithmetic mean roughness Ra of the inner surface SRF 1 may be e.g. in the range of 0.5 μm to 8 μm.
The distances between (microscopic) roughness features of the inner surface SRF 1 may exhibit random or pseudorandom variation so as to minimize or eliminate interference effects. The roughness features may comprise e.g. protrusions and depressions whose height or depth is e.g. in the range of 0.1 μm to 40 μm. The surface SRF 1 may be processed e.g. by abrasive blasting, by etching and/or by depositing a coating material so as to provide randomly positioned roughness features, whose height or depth is in the range of 0.1 μm to 40 μm. The surface SRF 1 may comprise randomly positioned protrusions and/or depressions such that the arithmetic mean roughness Ra of the inner surface SRF 1 is e.g. in the range of 0.5 μm to 8 μm.
The inner surface SRF 1 may be produced such that the specular reflectance of the inner surface SRF 1 is e.g. smaller than 50%, so as to ensure sufficient scrambling in the cell. The specular reflectance of the inner surface SRF 1 may be e.g. smaller than 10%, so as to ensure high degree of scrambling in the cell.
The inner surface SRF 1 may be produced such the total reflectance of the inner surface SRF 1 is greater than e.g. 80% at the wavelength λ LB0 of the illuminating light beam LB 0 , so as to ensure sufficient intensity of the transmitted light LB 2 . The total reflectance may be measured e.g. at an angle of incidence of 80%.
d LB0 denotes a transverse dimension of the illuminating beam LB 0 at the input end of the tunnel CAV 1 . The transverse dimension d LB0 may be e.g. in the range of 30% to 95% of the diameter d SRF1 of the tunnel CAV 1 . The transverse dimension d LB0 may be smaller than the diameter d SRF1 e.g. in order to reduce or eliminate optical feedback to the light source LS 1 .
The light source LS 1 may provide illuminating light LB 0 as an illuminating light beam. The illuminating beam LB 0 may have a divergence θ LB0 . The divergence θ LB0 of the illuminating beam LB 0 in a transverse direction may be e.g. greater than 20°.
The light source LS 1 may be e.g. a laser emitter. A laser beam LB 0 emitted from a laser emitter may have a fast axis direction and a slow axis direction. The fast axis direction is transverse with respect to the longitudinal direction of propagation of the laser beam LB 0 . The slow axis direction may be perpendicular to the fast axis direction and perpendicular to the longitudinal direction of the laser beam LB 0 . The divergence θ LB0 of the illuminating beam LB 0 in the transverse fast axis direction may be e.g. greater than 20°.
The illuminating beam LB 0 may be coupled into the cell 200 as a diverging beam. Coupling the illuminating beam LB 0 into the cell 200 as the diverging beam may further suppress the interferometric effects, by increasing the number of the reflections from the uneven phase-scrambling surface SRF 1 .
The longitudinal dimension L SRF1 of the inner surface SRF 1 may be e.g. in the range of 10 to 100 times a minimum diameter d SFR1 of the inner surface SRF 1 , and the divergence θ LB0 of the illuminating light beam LB 0 in a transverse direction may be e.g. greater than 30° so as to cause multiple consecutive reflections of the scrambled light LB 1 from the inner surface SRF 1 , before the scrambled light LB 1 is coupled out of the cell 200 as the transmitted light LB 2 .
The number of the multiple consecutive reflections of the scrambled light LB 1 from the inner surface SRF 1 may be in a suitable range e.g. in order to ensure sufficient degree of scrambling, wherein also ensuring a sufficient intensity of the transmitted light LB 2 .
When using the diverging beam LB 0 , the first optics LNS 1 ( a ) may be simplified or eliminated. The diverging beam may be provided without using the first optics LNS 1 . Eliminating the first optics LNS 1 may reduce interference effects cause by the first optics LNS 1 .
The optical assembly 300 may optionally comprise light gathering optics LNS 2 to collect light LB 2 to the detector DET 1 . The light gathering optics LNS 2 may comprise e.g. one or more lenses to focus light LB 2 to the detector DET 1 . A lens of the optics LNS 2 may be optionally arranged to operate also as the optical window WIN 2 of the cell 200 , in order to reduce the number of optical surfaces.
In an embodiment, the optical assembly 300 may also be implemented without the light gathering optics LNS 2 .
In an embodiment, a transparent output element of the light source LS 1 may be arranged to operate as the first window WIN 1 .
In an embodiment, a transparent input element of the detector DET 1 may be arranged to operate as the second window WIN 2 .
A transparent output element of the light source LS 1 operating as a window WIN 1 and/or a transparent input element of the detector DET 1 operating as a window WIN 2 may define the longitudinal dimension L 0 of the cell 200 .
In an embodiment, the first window WIN 1 and/or the second window WIN 2 may have an inclined orientation to further reduce disturbing reflections.
In an embodiment, the first window WIN 1 and/or the second window WIN 2 may have a wedge shape to further reduce disturbing reflections.
Referring to , the scrambling tunnel CAV 1 may effectively suppress the interferometric fringe effects caused by the windows WIN 1 , WIN 2 . The solid curve CRV 1 shows, by way of example, the spectral transmittance I LB2 (λ)/I 0 (λ) of the scrambling sample cell 200 . The spectral transmittance I LB2 (λ)/I 0 (λ) may be determined from the measured spectral intensity of light LB 2 transmitted through the scrambling sample cell 200 . The dashed curve CRV 0 shows, by way of example, the spectral transmittance I LB2 (λ)/I 0 (λ) of the conventional sample cell (see a and 1 b ).
In case of a conventional cell, the relative height of the (disturbing) spectral features PF k , PF k+1 , . . . caused by the interference effects may be e.g. in the order of 1%. In case of the scrambling cell, the relative height of (disturbing) spectral features may be substantially smaller, e.g. in the order of 0.1%. Thus, the scrambling cell may allow detecting a smaller relative deviation (I 0 (λ P1 )-I LB2 (λ P1 ))/(I 0 (λ P1 ) caused by an absorbing spectral line of a gaseous sample GAS 1 at a spectral position λ P1 . The deviation (I 0 (λ P1 )−I LB2 (λ P1 )) may represent a “signal”, and the reference intensity (I 0 (λ P1 ) may represent a “background”.
The scrambling cell may allow measurements at a lower signal-to-background ratio. A smallest detectable signal-to-background ratio (e.g. in the order of 0.1%) of the scrambling sample cell 200 may be substantially smaller than a smallest detectable signal-to-background ratio (e.g. in the order of 1%) of the conventional cell. The scrambling sample cell 200 may allow detecting a smaller concentration of an absorbing gas. Using the scrambling sample cell 200 may allow measuring the concentration of an absorbing gas with better accuracy. Using the scrambling sample cell 200 may allow measuring spectral data at a higher speed, when compared with the conventional cell.
shows, by way of example, an absorption spectrum of a gas sample GAS 1 which contains the carbon isotope 13 C and the oxygen isotope 18 O bound in carbon dioxide CO 2 , in addition to the normal carbon dioxide isotope compound 12 C 16 O 16 O. An isotope compound molecule may also be called e.g. as an isotopologue. Isotopologues are molecules that differ only in their isotopic composition.
A spectral intensity value I 1 (λ 1 ) associated with 13 C 16 O 16 O may be measured by setting the wavelength of the narrowband illuminating light LB 0 to a first spectral position λ 1 . A spectral intensity value I 2 (λ 2 ) associated with 12 C 16 O 16 O may be measured by setting the wavelength of the light LB 0 to a second spectral position λ 2 . A spectral intensity value I 3 (λ 3 ) associated with 12 C 16 O 16 O may be measured by setting the wavelength of the light LB 0 to a third spectral position λ 3 . A reference intensity value I 0 (λ 0 ) may be measured by setting the wavelength of the narrowband illuminating light LB 0 to a fourth spectral position λ 0 . In an embodiment, the reference intensity I 0 (λ) may also be a (non-constant) function of the wavelength λ.
The first spectral position λ 1 may substantially coincide with a first spectral peak P 1 of the isotope compound 13 C 16 O 16 O. The second spectral position λ 2 may substantially coincide with a second spectral peak P 2 of the isotope compound 12 C 18 O 16 O. The third spectral position λ 3 may substantially coincide with a third spectral peak P 3 of the isotope compound 12 C 16 O 16 O. The full spectrum of the CO 2 comprises a high number of peaks associated with the rotational-vibrational energy states of the different isotopes. The positions λ 1 , λ 2 , λ 3 may be selected from the spectral positions of the peaks of the CO 2 spectrum such that the peaks at the positions λ 1 , λ 2 , λ 3 do not significantly overlap with each other. The fourth spectral position λ 0 may be selected such that it does not overlap with any spectral peak of the sample GAS 1 . The positions λ 0 , λ 1 , λ 2 , λ 3 may also coincide with different spectral peaks than what is shown in .
The method may comprise guiding a gas sample GAS 1 into the scrambling cell 200 , and measuring e.g. the concentration of 13 C 16 O 16 O of the sample GAS 1 by measuring the spectral intensity of the transmitted light LB 2 .
Referring to a , the measuring apparatus 500 may be arranged to analyze the composition of a gaseous sample GAS 1 . The sample gas GAS 1 may be obtained e.g. from a processing system 1000 . The processing system 100 may be e.g. an industrial processing system. The system 1000 may be arranged to carry out e.g. a combustion process, a chemical process and/or a biochemical process.
The measuring apparatus 500 may be arranged to measure a spectrum SPEC 1 of a sample GAS 1 obtained from the processing system 1000 . The measuring apparatus 500 may be arranged to analyze a sample GAS 1 obtained from the processing system 1000 . The measuring apparatus 500 may be arranged to analyze the sample GAS 1 e.g. by comparing the measured spectrum SPEC 1 with reference data. The measuring apparatus 500 may be arranged to analyze the sample GAS 1 e.g. by comparing the measured spectrum SPEC 1 with a reference spectrum. The operation of the system 1000 may be controlled and/or optimized based on the analysis. The system 1000 may be arranged to control operation of said system 1000 based on the measured spectral data SPEC 1 , DATA 1 .
The system 1000 may be arranged to carry out e.g. a biological fermentation process. The system 1000 may be e.g. a fermentation system arranged to produce combustible gas from biological material. The measuring apparatus 500 may be arranged to measure e.g. the relative concentration of one or more of the following substances: carbon dioxide CO 2 , water vapor H 2 O, methane CH 4 , ethylene C 2 H 4 , isotope 18 O bound in CO 2 , isotope 13 C bound in CO 2 , isotope 17 O bound in CO 2 , isotope 18 O bound in water vapor H 2 O, methane CH 4 , ethylene C 2 H 4 , isotope 13 O bound in ethylene C 2 H 4 .
The sample gas GAS 1 may be guided to the cell 200 e.g. via a sampling line 100 . The apparatus 500 may optionally comprise one or more valves VAL 1 for controlling flow rate of the sample gas GAS 1 into the cell 200 . The valve VAL 1 may also be arranged to regulate an internal pressure of the sample cell 200 . The apparatus 500 may optionally comprise e.g. a pump PUMP 1 for causing a flow of the sample gas GAS 1 into the cell 200 . The optical measuring assembly 300 may be arranged to measure absorption spectrum of the sample GAS 1 contained in the cell 200 . The optical measuring assembly 300 may be arranged to provide spectral data DATA 1 by measuring absorption spectrum (SPEC 1 ) of the sample GAS 1 contained in the cell 200 .
Referring to b , the apparatus 500 may be arranged to analyze the composition of a gaseous sample GAS 1 . The sample gas GAS 1 may be guided to the cell 200 e.g. from a container BAG 1 . The sample gas GAS 1 may be stored and/or transported in a container BAG 1 . The container BAG 1 may be transportable and/or portable. The container BAG 1 may be e.g. a bag, a vial, a test tube, or a gas cylinder. The container BAG 1 may comprise e.g. flexible plastic foil coated with metal foil. The sample gas GAS 1 may be guided from the container BAG 1 to the cell 200 via a sampling line 100 . The container BAG 1 may comprise one or more valves for closing and opening the container. The apparatus 500 may optionally comprise e.g. a pump PUMP 1 for causing a flow of the sample gas GAS 1 into the cell 200 . Gas pressure inside the container BAG 1 may also be so high that a gas flow from the container to the cell 200 may be caused simply by opening the valve VAL 1 .
The optical measuring assembly 300 may be arranged to measure absorption spectrum of the sample GAS 1 contained in the cell 200 . The optical measuring assembly 300 may be arranged to provide spectral data DATA 1 by measuring absorption spectrum (SPEC 1 ) of the sample GAS 1 contained in the cell 200 .
Referring to c , the apparatus 500 may be arranged to analyze e.g. the composition of a respiratory air sample GAS 1 obtained from a subject SUB 1 The apparatus 500 may comprise a sampling line 100 for guiding an exhaled air sample GAS 1 to the cell 200 . The sampling line 100 may comprise e.g. a mask portion 102 to temporarily seal the sampling line 100 to the mouth and/or nose of the subject SUB 1 .
The optical measuring assembly 300 may be arranged to measure absorption spectrum of the sample GAS 1 contained in the cell 200 . The optical measuring assembly 300 may be arranged to provide spectral data DATA 1 by measuring absorption spectrum of the sample GAS 1 contained in the cell 200 .
The apparatus 500 may be arranged to monitor e.g. the concentration of an anesthetic agent in the respiratory air sample GAS 1 obtained from the subject.
The apparatus 500 may be arranged to monitor e.g. the ratio of a concentration of a first gaseous component to the concentration of a second gaseous component.
The apparatus 500 may be arranged to measure e.g. the concentration of 13 C bound in carbon dioxide of a respiratory air sample GAS 1 obtained from a subject SUB 1 . The apparatus 500 may be arranged to measure e.g. the concentration of the isotope compound 13 C 16 O 16 O to the concentration of the isotope compound 12 C 16 O 16 O in the sample GAS 1 .
The respiratory air sample GAS 1 may be obtained e.g. after administering a substance S 0 , which comprises 13 C. The measured concentration of 13 C may be used e.g. for measuring a metabolic rate of the subject. The metabolic rate of the first subject SUB 1 may be measured by a method, which comprises measuring the concentration of carbon isotope 13 C in the respiratory air of the first subject SUB 1 , after an amount of the substance S 0 has been administered to the first subject SUB 1 .
A part of the isotope 13 C may be converted into carbon dioxide CO 2 via one or more metabolic pathways in the body of the subject, after administering the test substance. The method may comprise sampling and analyzing respiratory air, which has been exhaled by the subject. The subject SUB 1 has a metabolic system SYS 1 , which may provide one or more metabolic pathways for the substance S 0 in the body of the subject SUB 1 . The subject SUB 1 may be e.g. a human being, or an animal. The metabolic system SYS 1 may comprise e.g. one or more internal organs of the subject SUB 1 .
Several gases may have absorbing transitions in the middle infrared range (MID-IR), i.e. at wavelengths, which are in the spectral range of 2.5 μm to 10 μm. The light source LS 1 may be arranged to emit light at one or more wavelengths, which are in range of 2.5 μm to 10 μm, and the detector DET 1 may be arranged to detect the light LB 2 transmitted through the sample cell 200 .
Referring to , the apparatus 500 may be arranged to measure the concentration of one or more gaseous components of the sample gas GAS 1 by measuring the intensity I LB2 of the transmitted light LB 2 at one or more wavelengths (λ 0 , λ P1 , λ P2 , λ P3 ), which are in the a spectral range from a first wavelength limit λ MIN to a second wavelength limit λ MAX . The method may comprise modulating the wavelength λ LB0 of the illuminating light e.g. in a spectral modulating range of λ MIN to λ MAX .
The absorption lines of the sample gas GAS 1 may be detected e.g. as local minima P 1 , P 2 , P 3 of the spectral transmittance I LB2 (λ)/I 0 (λ). The absorption lines may be detected e.g. as the (inverse) absorption peaks P 1 , P 2 , P 3 of the transmittance spectrum. The spectral transmittance I LB2 (λ)/I 0 (λ) may attain local minimum e.g. at spectral positions λ P1 , λ P2 , λ P3 . Each peak P may have a spectral width Δλ P . For example, the absorption line represented by the inverse peak P 1 may have a spectral width Δλ P1 . The spectral width Δλ P1 may be e.g. a full-width-at-half maximum width. The spectral width Δλ P1 may mean e.g. the spectral width at the spectral positions where the transmitted intensity I LB2 is equal to (I 0 (λ P1 )−(I 0 (λ P1 )−I LB2 (λ P1 ))/2).
The spectral width Δλ P1 of a gaseous substance may depend on the pressure of the sample gas GAS 1 . The spectral width Δλ P1 may be reduced by reducing the pressure of the sample gas GAS 1 . Reducing the pressure may improve effective spectral resolution and/or detection limit of the measuring apparatus, for measuring one or more substances in a gaseous sample. Reducing the pressure may facilitate measuring the concentration of a gaseous substance.
Reducing the pressure may facilitate measuring the ratio of concentrations of gaseous substances.
For example, the apparatus 500 may be arranged to measure the concentration of 13 C bound in carbon dioxide of a breathing air sample GAS 1 , by measuring the intensity I LB2 of the transmitted light LB 2 at one or more wavelengths (λ 0 , λ P1 , λ P2 , λ P3 ), which are e.g. in the spectral range of 4328.2 nm to 4329.2 nm. The wavelength λ LB0 of the light source LS 1 may be e.g. in the range of 4.3 μm to 4.4 μm.
The method may comprise guiding a gas sample GAS 1 into the scrambling cell 200 , and measuring the concentration of 13 C 16 O 16 O of the sample GAS 1 by measuring the spectral intensity of the transmitted light LB 2 .
The method may comprise guiding a gas sample GAS 1 into the scrambling cell 200 , and measuring the concentration of 12 C 18 O 16 O of the sample GAS 1 by measuring the spectral intensity of the transmitted light LB 2 .
The method may comprise guiding a gas sample GAS 1 into the scrambling cell 200 , and measuring the concentration of 12 C 16 O 16 O of the sample GAS 1 by measuring the spectral intensity of the transmitted light LB 2 .
The method may comprise guiding a gas sample GAS 1 into the scrambling cell 200 , and measuring a ratio of the concentration of carbon isotope 13 C bound in carbon dioxide to the concentration of carbon isotope 12 C bound in carbon dioxide by detecting spectral transmittance of carbon dioxide at three or more spectral positions (λ 0 , λ 1 , λ 2 ).
Referring to a , the measuring apparatus 500 may further comprise a pressure control system VAC 1 to control the internal pressure of the sample cell 200 . The system VAC 1 may be arranged to keep the internal pressure p GAS1 of the sample cell 200 at a predetermined value. The pressure control system VAC 1 may reduce the internal pressure p GAS1 .
The system VAC 1 may be arranged to keep the absolute pressure p GAS1 of the sample gas GAS 1 inside the sample cell 200 e.g. lower than 50 kPa (i.e. lower than 500 mbar). The system VAC 1 may be arranged to keep the absolute pressure pcAsi e.g. in the range of 1 kPa to 50 kPa (10 mbar to 500 mbar). The system VAC 1 may be arranged to keep the absolute pressure p GAS1 e.g. substantially equal to 7.5 kPa (75 mbar). Keeping the pressure p GAS1 at a low value may reduce the spectral width (e.g. Δλ P1 ) of spectral features of the spectrum SPEC 1 , by reducing an effect of spectral pressure broadening. Reducing the effect of the spectral pressure broadening may provide e.g. a lower signal noise and/or may provide a lower detection limit.
The pressure control system VAC 1 may comprise e.g. a first orifice VAL 1 , a second orifice VAL 2 , a pump PUMP 1 , a pressure sensor PSEN 1 , and a pressure control unit CNT 1 . The first orifice VAL 1 may be e.g. a fixed orifice or an adjustable valve. The second orifice VAL 2 may be e.g. a fixed orifice or an adjustable valve. The pump PUMP 1 may be arranged to draw gas out of the cell 200 , so as to reduce the internal pressure of the cell 200 . The pump PUMP 1 may draw sample gas GAS 1 into the cell 200 through the first orifice VAL 1 . The pressure difference po-pcAsi over the first orifice VAL 1 may depend on the flow rate of the sample gas GAS 1 through said first orifice VAL 1 . p 0 may denote the ambient pressure. The ambient pressure may be e.g. substantially equal to 100 kPa. The pump PUMP 1 and the first orifice VAL 1 may be arranged to provide a pressure difference po-pcAsi. The partial vacuum system VAC 1 may comprise a pressure sensor PSEN 1 to monitor the internal pressure pcAsi. The pressure control unit CNT 1 may be arranged to keep the internal pressure pcAsi at a predetermined value e.g. by controlling operation of one or more of the valves VAL 1 , VAL 2 and/or by controlling operation of the pump PUMP 1 . The pump PUMP 1 may be e.g. a piston pump, a diaphragm pump or an ejector.
Using the scrambling cell 200 under the reduced pressure pcAsi may reduce disturbing interference effects. The interference effects may include e.g. mechanical deformation of the cell 200 . The pressure difference (po-pcAsi) may deform and/or may displace the windows WIN 1 , WIN 2 so as to cause drifting of the spectral positions of the interference peaks (see e.g. the drifting Δλ drift of the peak PF k in b ). The pressure difference may cause forces F 0 , which may deform the cell 200 . The pressure forces F 0 may e.g. cause a change ΔL of the longitudinal dimension L 0 of the cell 200 .
The pressure difference (po-pcAsi) may also cause a change of the refractive index of the sample gas GAS 1 inside the cell 200 . The change of the refractive index may also cause drifting of the spectral positions of the interference peaks, by causing a corresponding change of the effective length of the optical path inside the cell 200 . Using the scrambling cell 200 may reduce the disturbing interference effects caused by the low gas pressure inside the cell.
The optional pressure reduction system VAC 1 may provide improved spectral resolution, detection limit and/or accuracy of the apparatus 500 .
However, the apparatus 500 may also be implemented without the pressure reduction system VAC 1 , e.g. in order to reduce manufacturing costs.
The measuring apparatus 500 may comprise:
•
• a tunable laser light source LS 1 to provide an illuminating light beam LB 0 , • a sample cell 200 for containing the gaseous sample GAS 1 , the cell 200 comprising an inner surface SRF 1 to provide scrambled light LB 1 by reflecting light of the illuminating light beam LB 0 such that the scrambled light is transmitted through the gaseous sample GAS 1 , and • a detector DET 1 to detect intensity I LB2 of transmitted scrambled light LB 2 guided through the sample cell 200 ,
wherein the measuring apparatus 500 is arranged to measure one or more spectral transmittance values (I LB2 (λ)/I 0 (λ)) of the sample GAS 1 by modulating the spectral position λ LB0 of the illuminating light LB 0 , and by detecting the intensity I LB2 of the transmitted light LB 2 at two or more different spectral positions (λ 0 , λ P1 ) of the illuminating light LB 0 ,
wherein a longitudinal dimension L SRF1 of the inner surface SRF 1 is in the range of 10 to 100 times a minimum diameter d SRF1 of the inner surface SRF 1 , and wherein the divergence θ LB0 of the illuminating light beam LB 0 in a transverse direction is greater than 20° so as to cause multiple consecutive reflections of the scrambled light LB 1 from the inner surface SRF 1 .
Referring to b , the apparatus 500 may further comprise a temperature control system TSYS 1 to stabilize the operating temperature of the sample cell 200 . The temperature control system TSYS 1 may comprise e.g. a heater unit TUNI 1 to heat the sample cell 200 , a temperature sensor TSEN 1 to measure the operating temperature of the sample cell 200 , and a temperature control unit CNT 2 to control the heating based on the measured operating temperature. The temperature control system TSYS 1 may comprise a heating unit TUNI 1 to increase the operating temperature of the cell 200 . The heating unit TUNI 1 may be e.g. a resistive electric heater.
The cell 200 may also be cooled instead or in addition to heating. The temperature control system TSYS 1 may be arranged to heat and/or cool the cell 200 . The temperature control system TSYS 1 may comprise a cooling unit TUNI 1 to decrease the operating temperature of the cell 200 . The cooling unit TUNI 1 may comprise e.g. a Peltier cooler.
The apparatus 500 optionally comprise a temperature control system to stabilize and/or to modulate operating temperature of the light source LS 1 . For example, the apparatus 500 may be arranged to adjust an operating temperature of a laser light source LS 1 in order to modulate the wavelength of the illuminating light LB 0 .
The apparatus 500 optionally comprise a temperature control system to stabilize operating temperature of the detector DET 1 .
Referring to a and 9 b , the tunnel CAV 1 may also be curved. A nonlinear tunnel CAV 1 may comprise one or more curved portions. For example, a centerline curve of the tunnel CAV 1 from the input end to the output end may have the shape of the (Latin alphabet) character “U”. The longitudinal dimension L 0 of the cell 200 may be measured from the inner surface of the input window WIN 1 to the inner surface of the output window WIN 2 along the nonlinear centerline curve of the tunnel CAV 1 .
The initial direction of propagation the illuminating light beam (LB 0 ) may be e.g. substantially opposite to the direction of propagation the transmitted light LB 2 , which is coupled out of the sample cell 200 . This arrangement may enable e.g. mounting the light source LS 1 and the detector DET 1 on the same support element, so as to provide a stable and compact structure. The tunnel CAV 1 may have one or more curved portions e.g. in order to allow mounting the light source LS 1 and the detector DET 1 on the same support element.
A nonlinear tunnel CAV 1 may be produced e.g. by mechanical machining and by processing the inner surface. A nonlinear tunnel CAV 1 may be produced e.g. by bending a section of a metal tube, and by processing the inner surface. A linear tunnel CAV 1 as shown e.g. in may be produced e.g. by drilling a piece of metal, and by processing the inner surface. The inner surface may be processed e.g. grinding, by abrasive blasting, by etching and/or by depositing a coating. The inner surface SRF 1 of the sample cell 200 may comprise e.g. aluminum, silver, gold, platinum, or rhodium. The inner surface may be optionally coated with a protective coating.
Referring to , the apparatus 500 may be arranged to measure temporal evolution of concentration of a substance. The apparatus 500 may be arranged to measure concentration as a function of time (t). The apparatus 500 may be arranged to measure temporal evolution of a ratio R of a concentration of a first substance to a concentration of a second substance. The apparatus 500 may be arranged to measure the ratio as a function of time (t). The first substance may be e.g. 13 C 16 O 16 O. The second substance may be e.g. 12 C 16 O 16 O.
The ratio R may have an initial value R(t 0 ) at a time t 0 . The ratio R may have a first value R(t 1 ) at a time t 1 . The ratio R may have a second value R(t 2 ) at a time t 2 . The initial value R(t 0 ) may be measured e.g. immediately after administering an amount of the substance S 0 to a subject SUB 1 . The first value R(t 1 ) and the second value R(t 2 ) may be measured after administering the amount of the substance S 0 , at the times t 1 and t 2 .
The initial value R(t 0 ) may represent a reference state of the system 1000 or a reference state of a subject SUB 1 . The initial value R(t 0 ) may also be called e.g. as a reference value of the measured concentration ratio, as a baseline value of the measured concentration ratio, or as a background value of the measured concentration ratio. The initial value R(t 0 ) may also be measured e.g. before administering an amount of the substance S 0 to a subject SUB 1 .
The system may measure a spectral transmittance function I LB2 (λ)/I 0 (λ) of a sample GAS 1 by varying the wavelength of the illuminating light LB 0 , and by measuring the intensity of the transmitted light LB 2 as a function of the wavelength. An absorption spectrum SPEC 1 of the sample GAS 1 may be subsequently determined from the measured spectral transmittance function I LB2 (λ)/I 0 (X).
At a predetermined wavelength λ, the ratio (I LB2 /L 0 ) of the spectral intensity I LB2 of transmitted light LB 2 to a reference value I 0 may depend on the concentration of a gaseous component of the sample, on the interaction length (L 0 ), on the temperature T GAS1 of the sample gas GAS 1 and/or on the pressure p GAS1 of the sample gas GAS 1 . Consequently, the concentration of the gaseous component may be determined by measuring the spectral intensity I LB2 of the transmitted light at one or more spectral positions, and by calculating the concentration of the gaseous component from the measured spectral intensity I LB2 and from a reference value I 0 .
The concentration of the gaseous component may also be determined by fitting a line profile to the measured function I LB2 (λ)/I 0 (λ) in the vicinity of an absorption peak of the gaseous component.
The concentration of the gaseous component may be determined from an absorption line area of the function I LB2 (λ)/I 0 (λ).
A first gaseous component may form a first absorption line by absorbing light at a first wavelength. A second gaseous component may form a second absorption line by absorbing light at a second different wavelength. The method may comprise comparing an area of a first absorption line to an area of a second absorption line. The method may comprise measuring a ratio of concentration of the first gaseous component to the concentration of the second gaseous component. The method may comprise determining a ratio of the concentration of the first component to the concentration of the second component based on the ratio of the area of the first absorption line to the area of the second absorption line.
For measuring a ratio of concentrations of isotopes, the second component may be e.g. the most abundant isotopologue of a molecule, and the first component may be e.g. a less abundant isotopologue of the same molecule.
The reference value I 0 may be e.g. a maximum value of the spectral intensity of transmitted light LB 2 . The reference value I 0 and/or the reference function I 0 (λ) may be determined e.g. by measuring an absorption spectrum of a (non-absorbing) reference gas sample, which does not comprise absorbing molecules in the spectral range of the measurement. The reference gas sample may be e.g. synthetic air, which does not comprise carbon dioxide. The reference gas sample may be formed e.g. by forming a mixture of pure gases or by removing carbon dioxide from an ambient air sample.
The “area” of the absorption line refers to an integral of the wavelength dependent absorption signal (I LB2 (λ)/I 0 (λ)) over a spectral range, which includes the central wavelength (e.g. λ P1 ) of the spectral line (e.g. P 1 ).
The spectral width of an absorption line profile may depend e.g. mainly on temperature-dependent Doppler broadening and on pressure-induced collisional broadening.
The method may comprise fitting a theoretical line profile to the measured data. The method may comprise e.g. determining a peak absorbance, temperature broadening, and/or pressure broadening by fitting a mathematical model, e.g. a Voigt profile, to the measured absorption data.
The method may further comprise determining a spectral scale of the measured data based on measured spectral positions of one or more spectral lines. Theoretical spectral positions of the spectral lines may be determined e.g. by using the high-resolution transmission molecular absorption database (HITRAN). The HITRAN database has been developed and maintained by the Atomic and Molecular Physics Division, Harvard-Smithsonian Center for Astrophysics.
Performing direct absorption spectroscopy may comprise measuring the spectral intensity of transmitted light at one or more spectral positions (wavelengths), and determining one or more properties of the sample by comparing the measured spectral intensity values with a reference value. Performing direct absorption spectroscopy may comprise measuring the spectral intensity of transmitted light at one or more spectral positions (wavelengths), and determining one or more properties of the sample by comparing the measured spectral intensity values with a reference spectrum. A reference spectrum of a reference gas may also be obtained e.g. by filling the sample cell 200 with the (non-absorbing) reference gas, and by using the measuring apparatus 500 for measuring the spectral transmittance of the reference gas.
The reference intensity I 0 (λ) may also be a (non-constant) function of the wavelength λ. For example, the wavelength λ LB0 of the illuminating light LB 0 may be modulated by varying an operating current of a semiconductor laser LS 1 , wherein the intensity I LB0 of the illuminating light LB 0 may vary as a function of the wavelength λ. The wavelength λ LB0 of the illuminating light LB 0 may be modulated by varying an operating current of a semiconductor laser LS 1 , wherein the intensity I LB0 , of the illuminating light LB 0 may vary as a function of the operating current. The method may comprise e.g. filling the cell 200 with a (non-absorbing) reference gas, by varying the wavelength λ LB0 of the illuminating light LB 0 , and by measuring a reference intensity function I 0 (λ) or a reference transmittance function I 0 (λ)/I LB0 when the cell 200 is filled with the reference gas.
A reference intensity function I 0 (λ) may be measured e.g. before and/or after measuring a spectrum of an absorbing sample GAS 1 . The reference intensity function I 0 (λ) may be optionally corrected e.g. by using one or more auxiliary reference intensity values I 0,AUX (λ 0 ). The one or more auxiliary reference intensity values I 0,AUX (λ 0 ) may be measured when the sample cell contains the absorbing sample GAS 1 , e.g. at a spectral position (λ 0 ) where the absorbing sample GAS 1 has low of negligible spectral absorbance. The reference intensity function I 0 (λ) may be optionally corrected e.g. by multiplying the reference intensity function I 0 (λ) with the ratio I 0,AUX (λ 0 )/I 0 (λ 0 ). The correction may compensate e.g. a drift of response of the detector. A measured spectral transmittance value I LB2 (λ)/I 0 (λ) may be optionally determined e.g. by using a measured intensity value I LB2 (λ), by using a reference intensity function I 0 (λ), and by using one or more auxiliary reference intensity values I 0,AUX (λ 0 ). A corrected spectral transmittance value may be determined e.g. by multiplying a measured spectral transmittance value I LB2 (λ)/I 0 (λ) with the ratio I 0 (λ 0 )/I 0,AUX (λ 0 ).
Light reflected back to a laser light source LS 1 may disturb operation of the laser light source LS 1 . The scrambling sample cell 200 may reduce or eliminate a disturbing effect caused by reflection of the transmitted light LB 2 from the detector DET 1 .
Using the scrambling sample cell 200 may reduce or eliminate a disturbing effect of temperature variations of the cell on the measured spectral data I LB2 (λ)/I 0 (λ), by reducing or eliminating disturbing interference effects.
The measuring apparatus 500 may be arranged to measure one or more spectral features of one or more substances selected from the following group: carbon dioxide CO 2 , carbon monoxide CO, water vapor H 2 O, methane CH 4 , ethylene C 2 H 4 , isotope 18 O bound in CO 2 , isotope 13 C bound in CO 2 , isotope 17 O bound in CO 2 , isotope 18 O bound in water vapor H 2 O, di-deuterium monoxide D 2 O, methane CH 4 , ethylene C 2 H 4 , deuterium (D) bound in ethylene C 2 H 4 , isotope 13 C bound in ethylene C 2 H 4 .
For the person skilled in the art, it will be clear that modifications and variations of the devices, apparatuses, and the methods according to the present invention are perceivable. The figures are schematic. The particular embodiments described above with reference to the accompanying drawings are illustrative only and not meant to limit the scope of the invention, which is defined by the appended claims.
Figures (8)
Citations
This patent cites (17)
- US3805074
- US5384640
- US5886348
- US6091504
- US6882426
- US20030202179
- US20040042006
- US20080231857
- US20080255769
- US20160084757
- US20170315052
- US0768521
- US1022558
- US2262338
- US2001133403
- US2008112955
- US2013036378